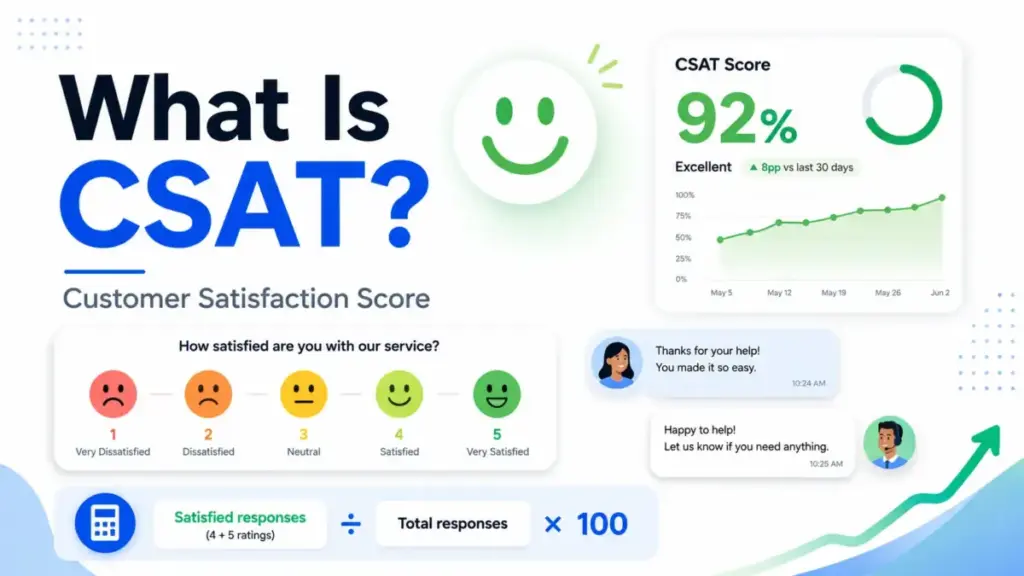
The percentage your support dashboard calls “CSAT” is built on a question most customers answer in under two seconds. That speed is the metric’s greatest strength and its most dangerous weakness. CSAT, or Customer Satisfaction Score, measures how satisfied customers are with a specific interaction, product, or service, expressed as the share of positive responses divided by total responses. It is one of the most widely used metrics across help desk platforms and customer experience programs, yet the number itself tells you almost nothing without the operational context around it.
This guide explains what CSAT means in practice, how to calculate it, the types of CSAT surveys you can run, where the metric misleads, how it differs from NPS and CES, which tools collect it, and how to build a feedback program that connects scores to actual service improvements. I evaluated CSAT implementations across Zendesk, Freshdesk, Qualtrics, SurveyMonkey, and Simplesat using official documentation, published pricing, and support community feedback.
Quick Answer: What Is CSAT? CSAT (Customer Satisfaction Score) is a customer experience metric that measures the percentage of customers who report a positive experience after a specific interaction, purchase, or support event. Teams calculate it by dividing satisfied responses by total responses and multiplying by 100. Unlike NPS, which measures loyalty, CSAT captures immediate, interaction-level sentiment.
The 60-Second Explanation of CSAT
At its simplest, CSAT is a survey question: “How satisfied were you with your experience?” Customers pick a rating. Teams count the positive answers. The score is a percentage.
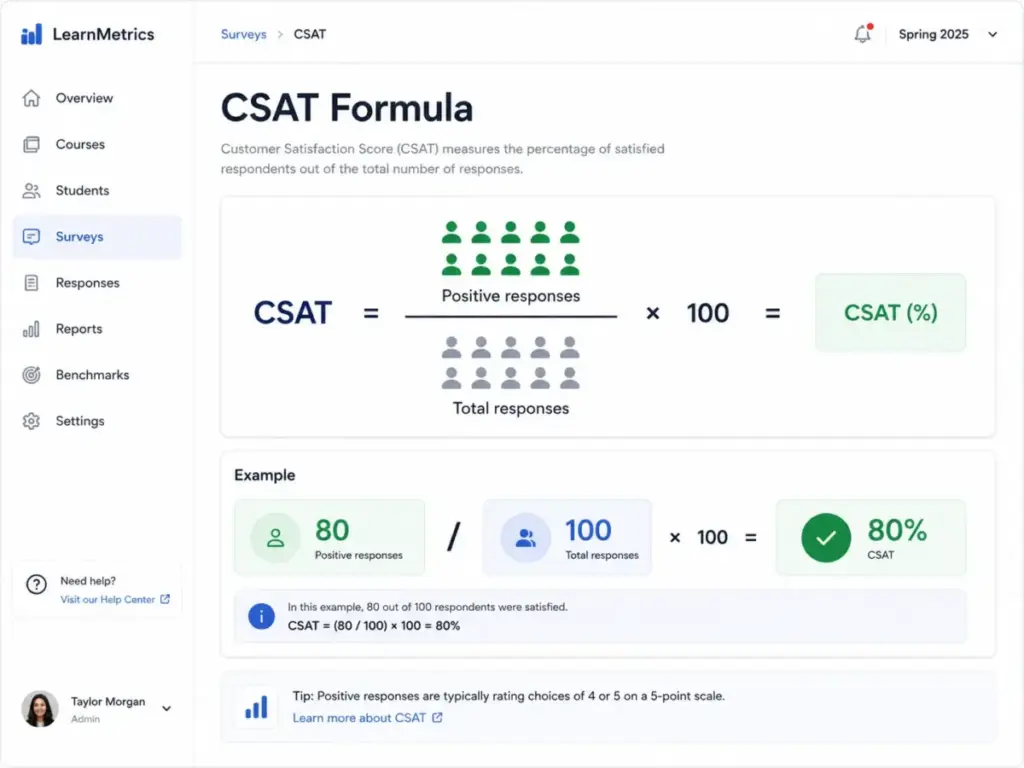
At a technical level, CSAT is calculated as: (Number of satisfied responses / Total responses) x 100. On a 1-5 Likert scale, most teams classify 4 and 5 as “satisfied.” On a binary scale (thumbs up / thumbs down), the positive choice counts. On a 1-10 scale, teams define a cutoff, often 8, 9, and 10. The scale choice and the cutoff rule both change the final number, which is why comparing CSAT scores across teams or vendors without matching their methodology produces meaningless comparisons.
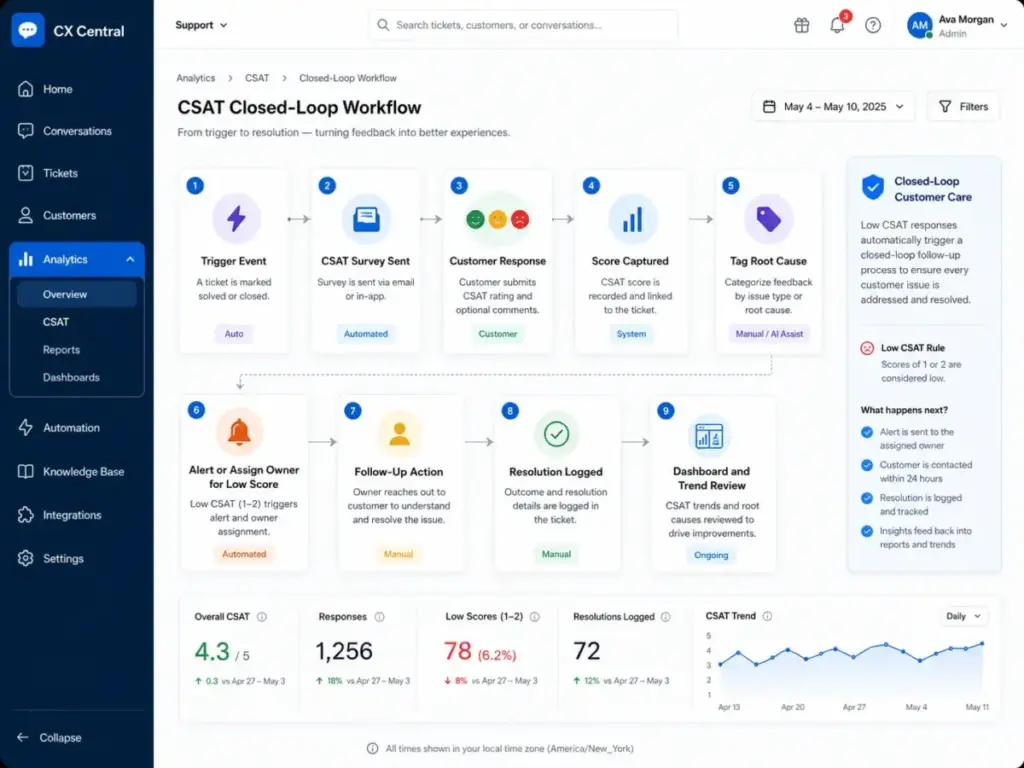
At a business level, CSAT is a leading indicator for customer service operations. A declining score after ticket resolution signals friction in agent workflows, product defects, or self-service gaps. A consistently high score with a low response rate signals survivorship bias, not satisfaction. The value of CSAT depends entirely on what teams do with the signal: connect it to ticket context, tag the root cause, follow up on low scores, and segment by channel, agent, issue type, and customer tier.
How CSAT Actually Works
CSAT follows a five-step feedback loop. Where it breaks determines whether teams get useful data or misleading percentages.
Step 1: Choose a touchpoint. Decide what you are measuring. A resolved support ticket, a completed onboarding, a product feature interaction, a delivery, or a periodic relationship check-in. Mixing touchpoints in one survey contaminates the data.
Step 2: Write the question. Keep it to one satisfaction question and one optional open-text follow-up. The standard form: “How satisfied were you with [specific experience]?” Adding more than two questions reduces completion rates, and response quality drops after the third question.
Step 3: Define the scale and the calculation rule before launch. For a 1-5 scale, define 4 and 5 as satisfied. For binary, define good versus bad. For 1-10, pick your cutoff. Changing the rule after you start collecting responses makes trend analysis unreliable.
Step 4: Trigger the survey close to the experience. Timing matters. Sending a CSAT survey 48 hours after ticket resolution captures a different sentiment than sending it immediately after the last agent reply. Most help desk software triggers CSAT surveys on ticket-solved status changes, but the gap between “solved” and “actually resolved” is where attribution problems start.
Step 5: Attach operational context. A score without context is a vanity metric. Effective CSAT programs tag each response with agent name, channel, ticket type, product area, customer plan, first-response time, resolution time, and escalation status. The score tells you “how many were satisfied.” The tags and comments tell you “why.”
Where it breaks: Low response rates (under 10-15%) skew results toward extreme experiences. Survey fatigue from over-triggering reduces quality. Missing context fields prevent root-cause analysis. And the biggest failure: teams treat the percentage as a performance grade instead of a diagnostic signal.
CSAT vs NPS vs CES: When to Use Each
| Metric | What it measures | Best timing | Scale | Limitations |
|---|---|---|---|---|
| CSAT | Satisfaction with a specific interaction | After ticket, purchase, onboarding | 1-5, binary, or 1-10 | Captures a moment, not loyalty |
| NPS | Likelihood to recommend | Quarterly or semi-annual | 0-10 (Promoters 9-10, Detractors 0-6) | Too broad for diagnosing specific issues |
| CES | Effort required to complete a task | After support interaction or self-service | 1-5 or 1-7 | Does not capture overall satisfaction |
What this means: CSAT is strongest for pinpointing operational friction at defined touchpoints. NPS works for tracking long-term brand sentiment and loyalty signals across accounts. CES reveals whether your process, not your product, is the problem. Most support teams need CSAT for day-to-day diagnostics and NPS or CES as a periodic strategic complement. Running all three on every interaction wastes survey budget and annoys customers.
Types of CSAT Surveys
Transactional CSAT measures satisfaction immediately after a specific event: a ticket resolution, a purchase, a delivery, an onboarding session. This is the most common type in support operations. It is strongest for diagnosing which channels, agents, or issue types produce friction.
Relationship CSAT measures broader satisfaction with the company or product over a period of time. Best used quarterly or semi-annually. It captures sentiment trends but cannot pinpoint which interaction caused the score to move.
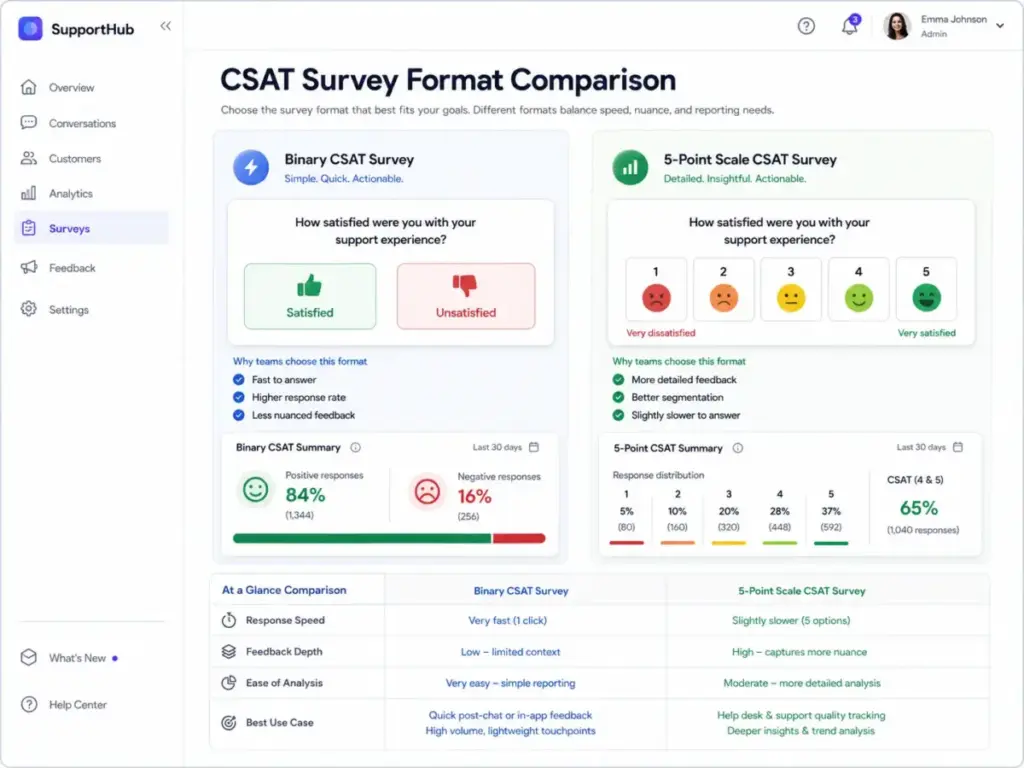
Binary CSAT uses two choices: good or bad, thumbs up or thumbs down, satisfied or unsatisfied. It is fast, gets higher response rates, and works well for in-app or embedded feedback. The tradeoff: it hides nuance. A customer who is mildly satisfied looks identical to one who is delighted.
Scaled CSAT uses 1-5, 1-7, or 1-10 rating scales. It allows more granularity, but teams must agree on which ratings count as “satisfied” before calculating the score. I have seen teams change their cutoff mid-year to inflate numbers, which defeats the purpose.
Predicted or AI-assisted CSAT uses conversation analytics, sentiment models, or AI scoring to estimate satisfaction when a customer has not completed a survey. Zendesk CX Trends 2026 reports that 95% of consumers expect an explanation for AI-made decisions, while only 37% of CX leaders currently provide reasoning behind AI decisions (Zendesk CX Trends 2026). Predicted CSAT expands coverage where response rates are low. It should be labeled as inferred sentiment, not presented as direct customer feedback. Blending predicted and reported CSAT in one dashboard without clear labeling misleads stakeholders.
Step-by-Step: How to Implement CSAT
1. Define the decision CSAT should support. Ticket quality? Onboarding quality? Product satisfaction? Overall relationship health? If you cannot name the decision, you are collecting data for a dashboard no one acts on.
2. Pick the survey type. Transactional for specific interactions. Relationship for periodic sentiment checks.
3. Choose a scale and calculation rule before launch. Document it. Share it with every team that will see the data. Do not change it without resetting your baseline.
4. Write one direct question and one optional open-text follow-up. Keep the survey under 30 seconds. Longer surveys get fewer completions and lower-quality responses.
5. Trigger the survey close to the experience. After ticket solved, onboarding completion, purchase confirmation, or key product action. The closer the trigger, the more accurate the signal. Build throttling rules to prevent survey fatigue: no more than one CSAT survey per customer per 7-14 days.
6. Attach operational context. Agent, channel, ticket type, product area, plan, customer segment, first-response time, resolution time, escalation status. This is where most teams cut corners, and it is exactly the data that makes CSAT actionable.
7. Build a closed-loop workflow for low scores. Notify the ticket owner. Review the ticket and conversation. Tag the root cause. Follow up with the customer where appropriate. A CSAT score without follow-up action is a missed feedback opportunity.
8. Report CSAT by segment and trend, not only as one global percentage. Compare by channel, queue, issue type, team, product area, and customer lifecycle stage. A single company-wide CSAT number hides the signals that matter.
9. Pair CSAT with NPS, CES, churn rate, renewal data, SLA metrics, resolution time, and qualitative feedback. CSAT as a standalone metric overpromises. Combined with operational data, it becomes useful.
10. Review survey design quarterly. Check response rate, bias indicators, over-surveying complaints, channel differences, and whether feedback is producing operational changes. If the score is stable but nothing changes internally, the program is performative.
The Mistakes That Cost Your First Quarter
Treating CSAT as a loyalty score. A customer who rates a support interaction 5/5 can still churn next quarter because of pricing, missing features, competitive switching costs, or contract timing. CSAT captures a moment, not a commitment.
Punishing agents based on individual CSAT scores without reviewing ticket context. When multiple agents, AI bots, or vendors touch a single ticket, the survey response reflects the entire experience, not just the last agent. Using raw CSAT for agent performance reviews without reviewing transfer history, AI bot path, and issue type creates unfair attribution.
Ignoring neutral responses. On a 1-5 scale, a rating of 3 is often excluded from both “satisfied” and “dissatisfied” counts. That means 30-40% of responses can disappear from the calculation. Teams that exclude neutrals report artificially inflated scores.
Reporting only the global average without sample size and response rate. A CSAT of 92% based on 15 responses means something very different from 92% based on 1,500. If your response rate is under 10%, the score reflects a self-selected minority, not your customer base.
Over-surveying customers. Sending a CSAT survey after every single ticket, chat, and email interaction trains customers to ignore surveys. Response quality drops. Use throttling, sampling, and trigger rules.
Labeling AI-predicted sentiment as customer-reported CSAT. Predicted CSAT is an inference from conversation data and sentiment analysis. It should be clearly separated from direct survey responses in every dashboard and report.
Comparing CSAT across teams without matching survey triggers and scales. A team using a binary survey after live chat will produce different scores than a team using a 1-5 scale after email tickets. Cross-team comparisons require standardized methodology.
Common Misconceptions About CSAT
Misconception: CSAT and NPS measure the same thing. Reality: CSAT measures satisfaction with a specific interaction or product. NPS measures likelihood to recommend, which reflects loyalty and brand sentiment. They answer different questions and serve different operational purposes.
Misconception: A high CSAT score proves customers will renew. Reality: Renewal depends on product value, pricing fit, switching costs, contract timing, stakeholder alignment, and competitive alternatives. CSAT can support retention analysis, but it does not predict it alone.
Misconception: One CSAT question is enough to understand your customers. Reality: The numeric score is a signal, not a diagnosis. Teams need open-text comments, driver tags, segmentation by channel and issue type, and closed-loop follow-up workflows to make CSAT operational.
Misconception: AI-predicted CSAT is the same as customer-reported CSAT. Reality: Predicted CSAT uses conversation analytics and sentiment models to estimate satisfaction. It should be labeled “predicted” or “modeled,” not presented as direct customer feedback.
Misconception: Every customer interaction should trigger a CSAT survey. Reality: Over-surveying reduces response quality. Use throttling (one survey per customer per 7-14 days), sampling, and trigger rules tied to specific touchpoints.
When CSAT Works and When It Misleads
| Use CSAT when | Avoid relying on CSAT alone when |
|---|---|
| You need fast feedback after a specific support interaction | You are measuring long-term loyalty or willingness to renew |
| You want to monitor service quality by channel, agent, or ticket type | You need to assess product-market fit |
| You need early warning signals for service issues | You are evaluating strategic account health |
| You want to connect customer sentiment to operational workflows | You need to predict revenue churn or expansion |
| You are measuring the impact of process changes on satisfaction | You are comparing performance across teams with different survey designs |
What Good CSAT Measurement Looks Like: Tools That Collect It
Five platforms handle CSAT collection across different use cases. Each comes with plan-level caveats.
| Tool | CSAT implementation | Public pricing (as of May 2026) | Caveat |
|---|---|---|---|
| Zendesk | Built-in CSAT surveys for solved email and messaging tickets. Customizable rating scales, labels, and follow-up questions for negative ratings. | Suite Team starts at 55/agent/month∗∗(annual).SuiteProfessionalat∗∗115/agent/month (Zendesk pricing). | Updated CSAT experience does not support legacy live chat. Full CSAT customization requires Suite Professional or higher. |
| Freshdesk | Built-in satisfaction surveys with agent-level reporting and configurable point scales. | Free plan available. Growth starts at 15/agent/month∗∗(annual).Proat∗∗49/agent/month (Freshdesk pricing). | CSAT reporting depth varies by plan. Advanced customer satisfaction analytics require Pro or Enterprise tier. |
| Qualtrics | Enterprise CX platform with survey feedback, CSAT triggers, AI-powered workflows, dashboards, and closed-loop action management. | Custom pricing only; no public per-seat rates (Qualtrics CX page). | Quote-based pricing with annual commitments. Designed for mid-market and enterprise. May be overkill for small support teams. |
| SurveyMonkey | CSAT survey templates, team collaboration, unlimited paid surveys, response analysis, sentiment analysis, and integrations. | Team Advantage starts at 25/user/month∗∗(annual,3−userminimum).TeamPremierat∗∗75/user/month (SurveyMonkey plans). | Free plan caps at 25 responses per survey. CSAT-specific features like custom branding and logic require paid plans. |
| Simplesat | Dedicated customer feedback tool for CSAT, NPS, CES, and 5-star metrics. Help desk integrations, survey dashboards, alerts, and reporting. | Standard starts at 99/month∗∗(upto3agents).Proat∗∗249/month (Simplesat pricing). | Response caps apply by plan. Standard allows up to 1,000 responses/month. |
What this means: If your team already runs Zendesk or Freshdesk, you have built-in CSAT collection. If you need cross-channel, multi-touchpoint CSAT programs with advanced analytics, Qualtrics or SurveyMonkey fits. Simplesat works for teams that want a focused feedback tool without the overhead of a full CX platform.
Why CSAT Matters More (and Less) in 2026
Zendesk CX Trends 2026 reports that 83% of consumers still believe experiences should be better than they are today. That gap between expectation and delivery makes feedback loops more important. At the same time, the American Customer Satisfaction Index (ACSI) Q1 2026 release shows U.S. customer satisfaction fell to 76.7 on a 100-point scale while complaints rose 16% (ACSI Q1 2026).
AI support is raising the stakes. Zendesk reports that 74% of consumers now expect customer service to be available 24/7 because of AI, and 88% expect faster response times than one year earlier. These expectations change what CSAT measures: not just whether the human agent was polite, but whether the AI handoff was clear, the self-service article resolved the issue, and the automated routing sent the ticket to the right queue.
“When customers come back for more, even if they are less than satisfied, pent-up defection intensifies.” — Claes Fornell, founder of the ACSI and Professor Emeritus, University of Michigan (ACSI Q1 2026)
That quote challenges the idea that a stable CSAT score means a stable customer base. Pent-up defection, where customers stay out of inertia rather than satisfaction, is invisible in CSAT data until it is too late.
How to Measure CSAT Effectiveness
| Metric | What it tells you | Why it matters |
|---|---|---|
| CSAT percentage | Share of satisfied responses | Headline indicator, not a diagnostic by itself |
| Response rate | What percentage of surveyed customers answered | Below 10-15%, the score reflects a biased sample |
| Low-score recovery rate | How often your team follows up on dissatisfied responses | Measures whether feedback creates action |
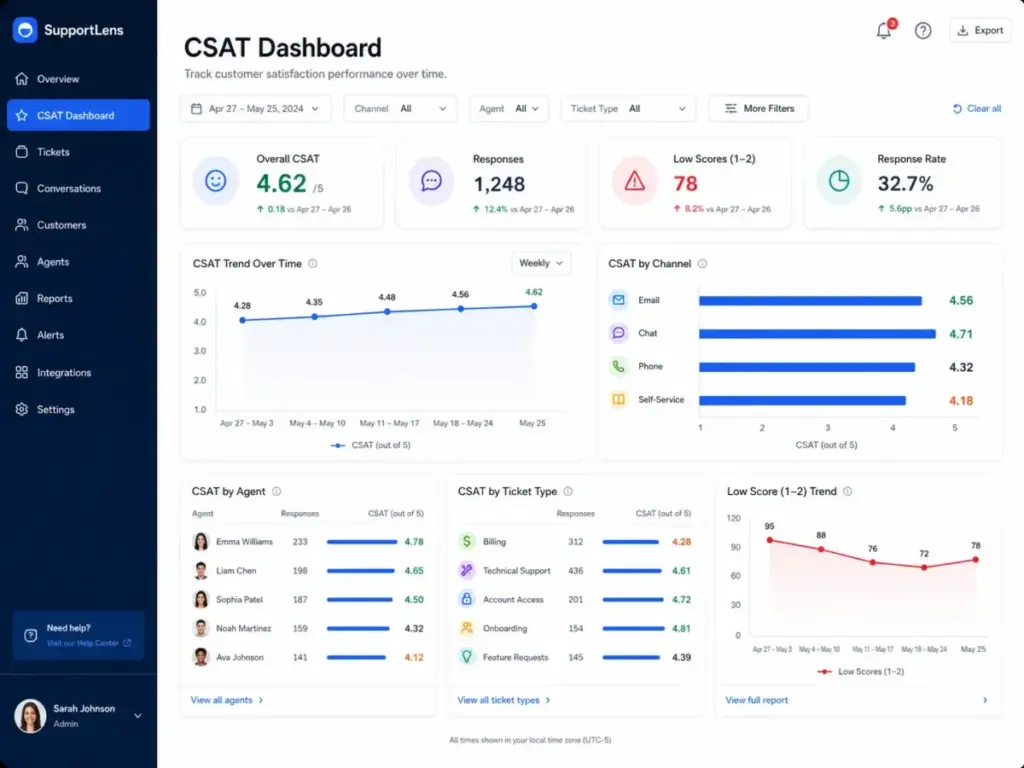
| CSAT by channel | Satisfaction split by email, chat, phone, self-service | Identifies which channels produce friction |
| CSAT by ticket type | Satisfaction by issue category | Reveals product or process problems |
| Open-text theme frequency | Most common topics in free-text comments | Explains the “why” behind the number |
| Time to follow up on dissatisfied responses | How fast your team reacts to negative feedback | Longer delays correlate with higher customer churn |
CSAT Beginner Checklist
Use this checklist before launching your first CSAT program:
- Define the specific decision CSAT will inform (ticket quality, onboarding, product satisfaction)
- Choose one survey type: transactional or relationship
- Pick a scale (binary, 1-5, or 1-10) and document which ratings count as “satisfied”
- Write one satisfaction question and one optional open-text follow-up
- Set the survey trigger event (ticket solved, onboarding complete, purchase confirmed)
- Configure throttling rules (maximum one survey per customer per 7-14 days)
- Attach metadata to each response: agent, channel, ticket type, product area, plan
- Build a notification workflow for scores below your threshold
- Set a baseline response rate target (aim for 15%+ to reduce bias)
- Schedule quarterly reviews of survey design, response rate, and operational impact
When You Need CSAT Software
You need dedicated CSAT tracking when:
- Your support team handles more than 100 tickets per month and cannot manually review every interaction
- You need to segment satisfaction by agent, channel, issue type, or customer tier
- You want automated follow-up workflows for dissatisfied responses
- Your current help desk survey is limited to binary ratings without reporting depth
- You are running AI or bot-assisted support and need to track handoff quality
You do not need CSAT software yet when:
- Your team handles fewer than 50 tickets per month and can review each one manually
- You are a solo operator who directly communicates with every customer
- Your primary feedback channel is already qualitative (phone calls, direct email)
How to Choose the Right CSAT Tool
- Start with your existing help desk. Zendesk, Freshdesk, Intercom, and Help Scout all include basic CSAT surveys. Check whether your current plan covers what you need before buying a separate tool.
- Check response caps and plan limits. Simplesat caps at 1,000 responses/month on Standard. SurveyMonkey caps free plans at 25 responses. Match caps to your ticket volume.
- Evaluate integration depth. CSAT data is useful only when connected to ticket context. Look for native integrations with your help desk, CRM, and reporting tools.
- Look for open-text analysis and tagging. The numeric score is the headline. The comments are the diagnostic layer. Tools with sentiment analysis and thematic tagging reduce manual review time.
- Assess closed-loop workflow support. Can the tool notify the ticket owner on a low score, create a follow-up task, and track resolution? Without this, feedback collection is passive.
- Verify pricing at your team size. Calculate the cost for your current agent count and projected growth. Per-agent pricing on Zendesk at 15 agents costs 825/month∗∗onSuiteTeam(annual).FreshdeskProat15agentscosts∗∗735/month. Factor these into your support operations budget.
- Check reporting granularity. Can you segment CSAT by channel, queue, agent, ticket type, and time period? If the tool only shows a single global score, it will not support operational decisions.
For a broader view of customer retention strategies and how CSAT fits alongside churn, renewal, and engagement metrics, pair this guide with your voice-of-customer program design.
Related Resources
FAQ
What does CSAT stand for?
CSAT stands for Customer Satisfaction Score. It measures the percentage of customers who report a positive experience after a specific interaction, purchase, or service event.
How do you calculate CSAT?
Divide the number of satisfied responses by the total number of responses, then multiply by 100. On a 1-5 scale, most teams count ratings of 4 and 5 as satisfied. On a binary scale, the positive choice counts.
What is a good CSAT score?
CSAT scores vary by industry, channel, and survey methodology. A score above 80% is common for B2B SaaS support teams, but the number is only meaningful when paired with response rate, sample size, and consistent measurement methodology. Comparing scores across companies without matching these factors produces misleading conclusions.
Should I use CSAT or NPS after a support ticket?
CSAT. NPS measures willingness to recommend and is better suited for quarterly or semi-annual relationship surveys. CSAT captures satisfaction with a specific interaction, which is what a resolved ticket represents.
Can I calculate CSAT on a 1-10 scale?
Yes. Define which ratings count as “satisfied” before you start collecting. A common cutoff is 8, 9, and 10. The key is consistency: changing the cutoff mid-program breaks trend analysis.
Should neutral ratings count against CSAT?
Most CSAT calculations exclude neutral ratings (e.g., 3 on a 1-5 scale) from both numerator and denominator. This is standard but can inflate scores. Track neutral response share separately and report it alongside CSAT.
How many questions should a CSAT survey have?
One satisfaction question and one optional open-text follow-up. Adding more questions reduces response rates and response quality. If you need deeper insights, use periodic relationship surveys with more questions, not your transactional CSAT survey.
Can AI predict CSAT without a survey?
Yes. Platforms like Sprinklr and Zendesk use conversation analytics and sentiment models to estimate satisfaction. Predicted CSAT expands coverage where response rates are low, but it should be labeled as inferred, not reported as direct customer feedback.
How do I stop CSAT from unfairly blaming agents?
Review ticket ownership, transfer history, AI bot interactions, and issue type before using CSAT for performance coaching. When multiple agents or bots touch a ticket, the survey reflects the full experience, not just the last responder.
How often should I review my CSAT program?
Quarterly. Check response rates, bias indicators, over-surveying complaints, channel differences, and whether the feedback is producing operational changes. If the score is stable but nothing changes internally, the program is not working.