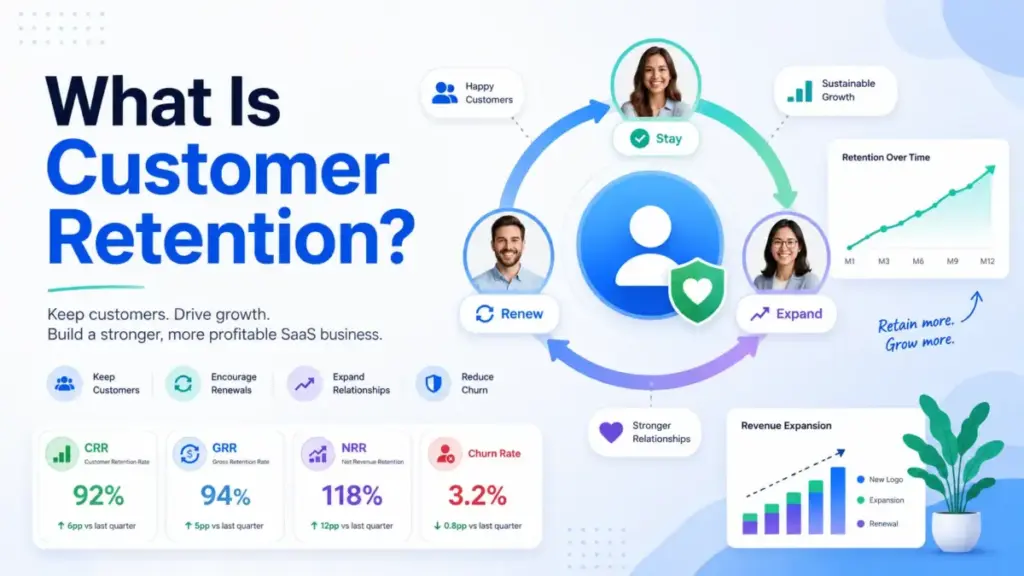
Customer retention is not a single metric. It is a system of interconnected measurements, signals, interventions, and ownership decisions that determine whether your existing customers keep paying, keep using, and keep expanding, or quietly disappear.
Most definitions you will find online reduce retention to one formula and a list of loyalty tips. That framing misses the operational reality SaaS teams face every quarter: logo retention can look healthy while revenue shrinks, satisfaction scores can stay high while renewals drop, and onboarding gaps can cause churn six months before anyone notices the warning signs.
This guide explains what customer retention means in practice, how to calculate it across multiple dimensions, which metrics actually predict renewal behavior, what tools support retention workflows, and when retention investment stops making sense. If your team manages CRM software or any recurring-revenue product, retention is the operating system underneath your growth math.
Quick Answer: Customer retention is an organization’s ability to keep existing customers buying, renewing, or staying active over a defined period. In SaaS, it measures how many customers or how much revenue stays subscribed after excluding new acquisitions. Retention depends on onboarding, product adoption, support quality, customer health scoring, and renewal management, not just satisfaction surveys or loyalty rewards.
The 60-Second Explanation of Customer Retention
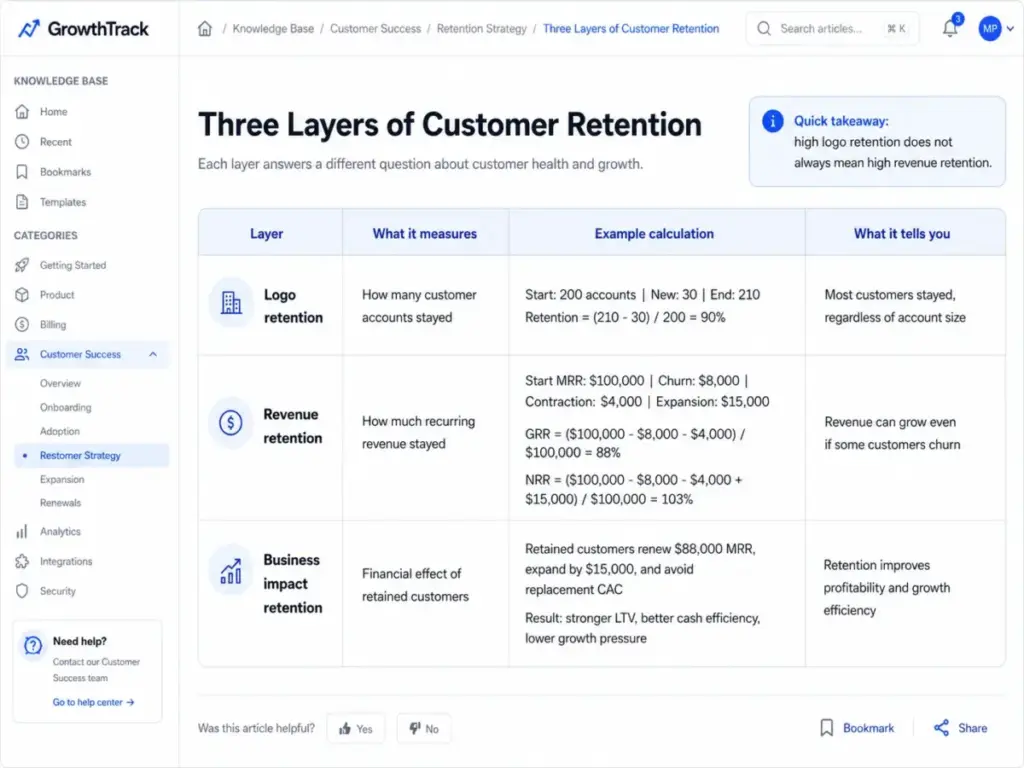
Customer retention at its simplest means keeping the customers you already have. Instead of measuring how many new customers arrive, retention measures how many existing customers stay over a month, quarter, or year. A company that starts January with 200 customers, adds 30 new ones, and ends with 210 total retained 90% of its original base: (210 minus 30) divided by 200, multiplied by 100.
That is the logo view. It tells you how many accounts stayed.
The technical view adds revenue. Gross revenue retention (GRR) tracks how much recurring revenue you kept from existing customers before counting any expansion. Net revenue retention (NRR) includes upgrades, expansion, cross-sells, and add-ons. According to SaaS Capital’s 2026 benchmark, the median NRR for bootstrapped SaaS companies with $3M to $20M ARR is 103%, and the median GRR is 91%. Those numbers mean the typical SaaS company loses about 9% of existing revenue to churn and contraction each year but recovers it (and then some) through expansion.
The business view ties retention to capital efficiency. As Harvard Business Review noted, acquiring a new customer is anywhere from five to 25 times more expensive than retaining an existing one. Strong retention reduces the pressure on sales teams to replace lost revenue, improves lifetime value, and generates compounding returns from customers who expand over time.
Understanding retention requires separating these three layers because they answer different questions. A company with 95% logo retention and 85% GRR is keeping most accounts but losing revenue from the accounts that stay. A company with 88% logo retention and 110% NRR is losing some accounts but growing revenue from the rest. The metrics tell you where to intervene.
How Customer Retention Actually Works
Customer retention works by identifying which customers should continue receiving value, measuring their behavior, and intervening before value gaps turn into cancellations. That sounds simple. The execution is not.
A basic retention system starts with a defined cohort: customers active at the beginning of a month, quarter, or year. The team excludes new customers acquired during the period and calculates how many original customers stayed. In SaaS, that logo calculation pairs with revenue views (GRR and NRR), product usage data, support interactions, onboarding progress, billing status, and renewal signals.
Here is where most retention definitions stop. The operational reality involves connecting data across six or more systems:
- Define the retention object. Decide whether you are tracking customers, accounts, workspaces, users, subscriptions, contracts, or revenue cohorts. Each object answers a different question.
- Set the measurement window. Monthly retention suits product-led growth companies. Quarterly or annual retention suits enterprise SaaS with longer contracts.
- Calculate the baseline. Use the standard CRR formula: (customers at end of period minus new customers acquired) divided by customers at start, multiplied by 100.
- Layer revenue metrics. Add GRR (revenue retained before expansion) and NRR (revenue after churn, contraction, and expansion combined).
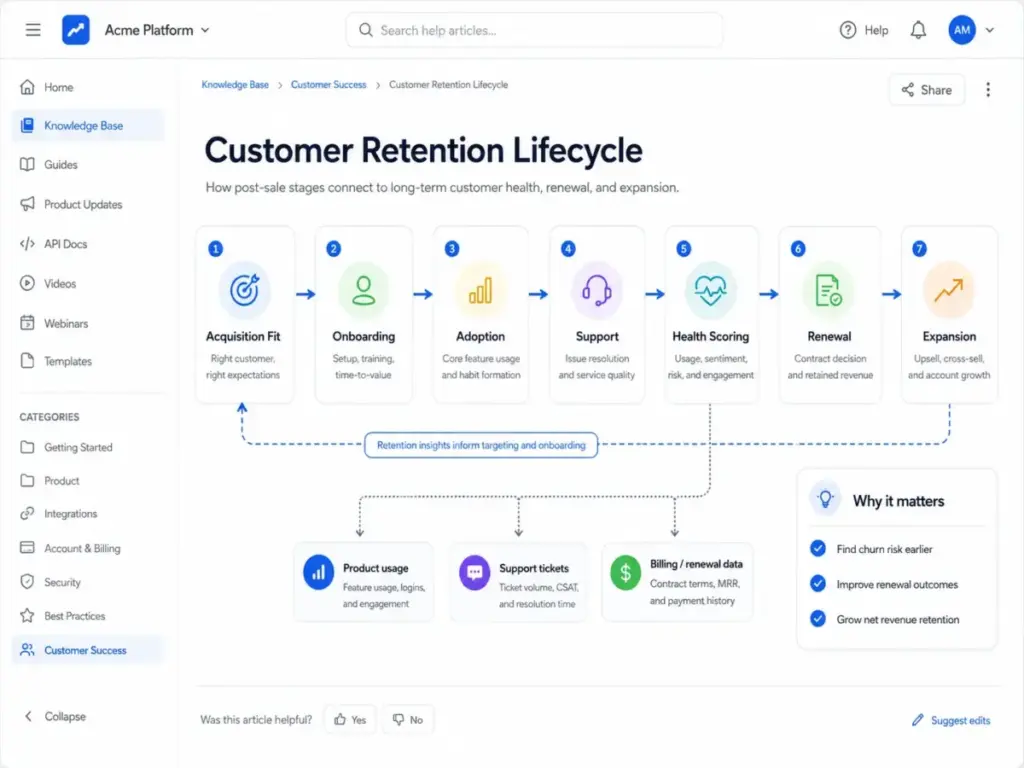
- Map the retention lifecycle. Retention does not start at renewal. It starts at acquisition fit, moves through handoff, onboarding, activation, product adoption, support quality, customer 360 visibility, health scoring, risk intervention, renewal planning, and expansion outreach.
- Build intervention triggers. Connect CRM data, product usage, support tickets, customer feedback, commercial terms, and health scores so CS, support, product, and sales teams know which customers need help.
The failure points sit between these steps. Onboarding stalls because the handoff from sales lost context. Product adoption drops because the customer only uses one feature. Support tickets pile up with no escalation path to the account owner. Billing issues go unresolved because finance and CS do not share a dashboard. The champion who bought the product leaves the company, and no one at your company notices for three months.
Mature retention programs connect these signals into a single operating view. That is why customer success platforms like Gainsight, ChurnZero, and Totango exist: they aggregate health data from multiple sources and trigger playbooks based on risk patterns.
Customer Retention vs Related Concepts
One reason retention discussions get confusing is that teams use related terms interchangeably. They are not the same.
| Concept | What it measures | When to use it | Key difference from retention |
|---|---|---|---|
| Customer churn | Customers lost over a period | Inverse of logo retention | Churn is the loss; retention is what stayed |
| Churn rate | Percentage of customers who left | Monthly or annual reporting | Churn rate + retention rate = 100% |
| Customer loyalty | Willingness to recommend or repurchase | NPS, repeat purchase, referral tracking | Loyalty is a sentiment; retention is a behavior outcome |
| Customer success | Proactive discipline ensuring customers achieve outcomes | CS team operations, health scoring, QBRs | CS is a function; retention is a result CS contributes to |
| Customer lifetime value | Total revenue a customer generates over their relationship | Forecasting, pricing, segment investment | LTV depends on retention duration and expansion |
| Customer engagement | Depth and frequency of product interactions | Product analytics, usage tracking | Engaged users can still churn if business value breaks |
The most common confusion is between retention and loyalty. A satisfied, loyal customer can still churn if their budget gets cut, their champion leaves, a competitor offers a migration incentive, or the product no longer fits their workflow. Retention is the outcome. Loyalty is one input.
The second confusion is between retention and customer lifecycle management. The lifecycle describes the full journey from prospect to advocate. Retention is the measurement of whether customers stay through the middle and late stages of that lifecycle.
Step-by-Step Implementation: Building a Retention System
Most teams want a simple checklist. The real work requires cross-functional data, clear ownership, customer segmentation, and repeatable workflows. Here is how to build a retention system that actually works.
Step 1: Pick your retention metrics
Do not track everything. Start with three:
- Logo retention rate for account-level health
- Gross revenue retention for revenue quality before expansion
- Net revenue retention for the full picture including upgrades
Calculate each monthly and review quarterly. If your GRR is below 85%, focus on reducing churn and contraction before investing in expansion.
Step 2: Segment customers by value and risk
Not every customer deserves the same retention investment. Segment by annual contract value, plan tier, lifecycle stage, acquisition channel, industry, account size, and support burden. A $50K/year enterprise account with declining usage needs a different intervention than a $500/month self-serve account that just completed onboarding.
Step 3: Map your retention drivers
Identify which activities correlate with renewal and which correlate with churn. Common retention drivers include:
- Onboarding completion within the first 30 days
- Adoption of at least 3 core features
- Executive sponsor engagement
- Support ticket resolution within SLA
- Regular product usage (weekly active users or key actions)
- Billing reliability (no failed payments, no downgrade requests)
- Positive sentiment in surveys or check-ins
Step 4: Build a customer health score
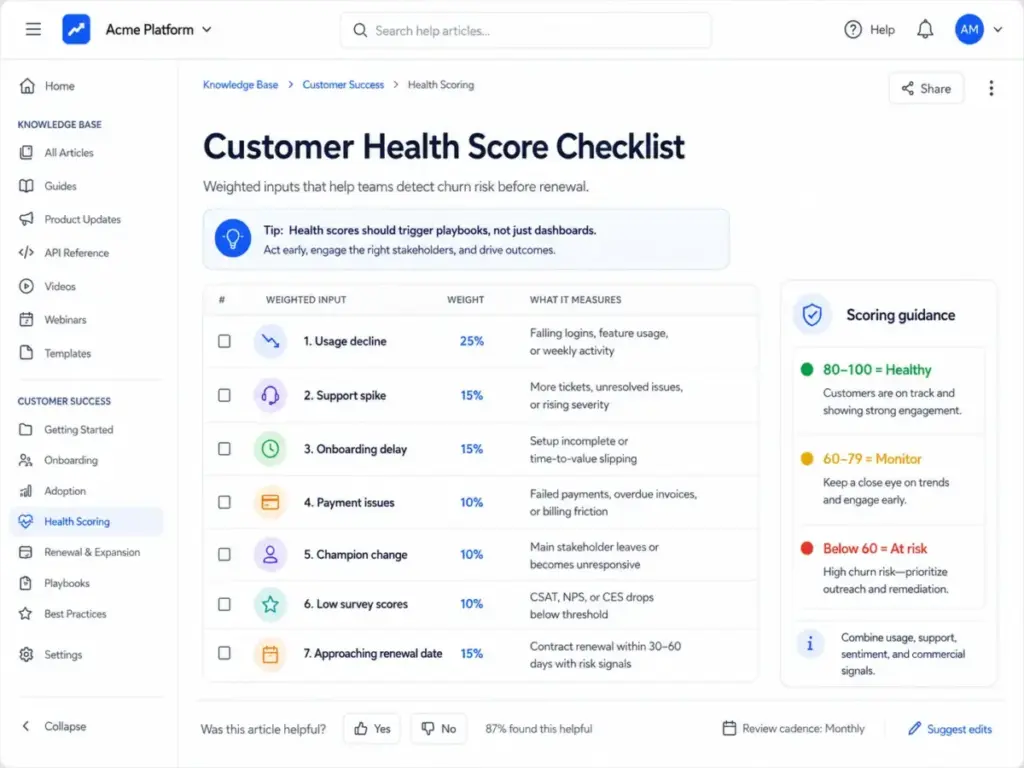
A health score combines multiple signals into a single risk indicator. Inputs typically include product usage frequency, support ticket volume and severity, onboarding milestone completion, survey scores, payment status, stakeholder engagement, and time until renewal.
Weight the inputs based on which signals most predict churn in your business. Then connect the health score to action. A score without a playbook is just a dashboard decoration.
Step 5: Create playbooks for common risk patterns
Build repeatable intervention workflows for:
- Inactive champion: The person who bought the product stops logging in. Trigger outreach to identify new stakeholder.
- Stalled onboarding: Customer has not completed setup after 21 days. Trigger CS-led onboarding session.
- Low feature adoption: Customer uses only 1 of 5 core features. Trigger education campaign.
- Unresolved tickets: Open tickets exceed SLA for 7+ days. Trigger escalation to account owner.
- Payment failure: Subscription payment fails twice. Trigger billing team outreach before involuntary churn.
- Contract downgrade inquiry: Customer asks about downgrading. Trigger retention conversation with value reinforcement.
- Poor survey feedback: NPS detractor or CES score below threshold. Trigger CS follow-up within 48 hours.
Step 6: Assign cross-functional ownership
Retention fails when it becomes a vague customer success responsibility. CS owns onboarding and health monitoring. Support owns ticket resolution and escalation. Product owns adoption and usage analytics. Sales owns renewal negotiation and expansion. Billing owns payment reliability. Leadership owns the retention target and resource allocation.
Step 7: Review and iterate
Review cohort retention monthly. Review renewal outcomes quarterly. Update health score weights when churn reasons shift. Audit playbook effectiveness every quarter. Retire playbooks that do not improve outcomes.
The Mistakes That Waste Your First 6 Months
I have watched teams invest heavily in retention programs and still miss their targets. The pattern is usually one of these mistakes.
Mistake 1: Treating all customers as equally worth retaining. A customer paying $200/month who generates 15 support tickets per week costs more to retain than they contribute. Segment your customers and allocate retention effort proportionally. Some accounts are better off churning.
Mistake 2: Calculating retention without properly excluding new customers. The CRR formula requires subtracting new customers acquired during the period from the end count. Skip this step and your retention rate looks artificially high.
Mistake 3: Relying on NPS alone as a retention predictor. NPS measures willingness to recommend, not willingness to renew. A customer can give you a 9 and still cancel because their budget changed, their use case shifted, or a competitor made a better offer. Combine NPS with usage data, support interactions, and commercial signals.
Mistake 4: Building a health score that no workflow acts on. A red account in a dashboard is meaningless if no one has a playbook for what to do next. Connect every health threshold to a specific intervention.
Mistake 5: Confusing product usage with business value. A customer logging in daily does not guarantee they are getting value. They could be stuck in a broken workflow. Measure outcomes (deals closed, reports generated, tasks completed), not just logins.
Mistake 6: Letting support, product, sales, and billing data stay disconnected. If the CS team cannot see that a customer has three open tickets, a failed payment, and a renewal in 45 days, they cannot intervene effectively. Data silos are the structural cause of most retention failures.
Mistake 7: Waiting until 30 days before renewal to start retention work. By the time renewal is 30 days away, the customer has already decided. Retention starts during onboarding and continues through every interaction.
Common Misconceptions About Customer Retention
Misconception: Customer retention is the same as customer satisfaction.
Satisfaction can support retention, but they measure different things. Retention is an outcome measured through continued buying, renewal, or usage. A satisfied customer can still churn if budget, product fit, switching pressure, or implementation value breaks down. Satisfaction is one signal. Retention is the result.
Misconception: A high retention rate always means the business is healthy.
A company with 97% logo retention could be losing its three largest accounts while keeping hundreds of small ones. That 97% hides revenue contraction, low expansion, and declining average contract value. Always pair logo retention with GRR, NRR, and cohort analysis.
Misconception: Retention starts after renewal risk appears.
Retention starts during acquisition, when the sales team sets expectations. It continues through handoff, onboarding, activation, adoption, and ongoing support. By the time a “renewal risk” flag appears, the retention failure happened months earlier.
Misconception: Retention can be fixed with loyalty rewards alone.
Rewards and discounts can reduce churn in some B2C or ecommerce contexts. In SaaS, retention depends on onboarding quality, product value delivery, adoption depth, support responsiveness, stakeholder alignment, and renewal economics. A 10% renewal discount does not fix a product that customers are not using.
When to Use and When to Avoid Retention Investment
Use retention investment when:
- Revenue is recurring and contract renewals drive growth
- Onboarding quality directly affects long-term product usage
- Customer segments have meaningfully different lifetime values
- Churn is measurable and attributable to specific causes
- Existing customers can expand, upgrade, advocate, or refer
Avoid over-investing in retention when:
- The customer is a poor-fit account that will never achieve the outcome your product delivers
- Support cost is structurally higher than the revenue the account generates
- The customer lacks the core problem your product solves (they bought for the wrong reason)
- Retention efforts delay necessary product positioning or acquisition fixes
- The team is spending more on retention theater (dashboards, QBRs, surveys) than on the systemic issues causing churn
This is the contrarian point most retention guides avoid. Not every customer should be retained. Keeping low-fit, high-cost accounts active inflates logo retention while draining support capacity, distorting product feedback, and reducing net margin. Revenue-quality retention means retaining the right customers, not retaining everyone.
How to Measure Success: Customer Retention Metrics
| Metric | What it measures | Formula logic | Common misread |
|---|---|---|---|
| Customer retention rate (CRR) | Percentage of customers retained | (End customers minus new) / Start customers x 100 | Ignoring that “customer” is undefined: account, user, or workspace? |
| Logo retention | Accounts that stayed, regardless of account size | Same as CRR but explicitly at the account level | Hiding revenue contraction behind high account counts |
| Gross revenue retention (GRR) | Revenue retained before expansion | (Starting MRR minus churn minus contraction) / Starting MRR x 100 | Confusing GRR with NRR; GRR cannot exceed 100% |
| Net revenue retention (NRR) | Revenue after churn, contraction, expansion, and upgrades | (Starting MRR minus churn minus contraction plus expansion) / Starting MRR x 100 | Assuming NRR above 100% means zero churn (it does not) |
| Churn rate | Percentage of customers or revenue lost | Inverse of retention: 100% minus retention rate | Using monthly churn without annualizing (5% monthly = 46% annual) |
| Usage retention | Whether users continue returning to the product | DAU/MAU ratio, feature adoption rates, session frequency | Equating logins with value delivery |
| Cohort retention | Retention for a group acquired in the same period | Track a specific cohort over 3, 6, 12 months | Mixing cohorts obscures which acquisition channels produce durable customers |
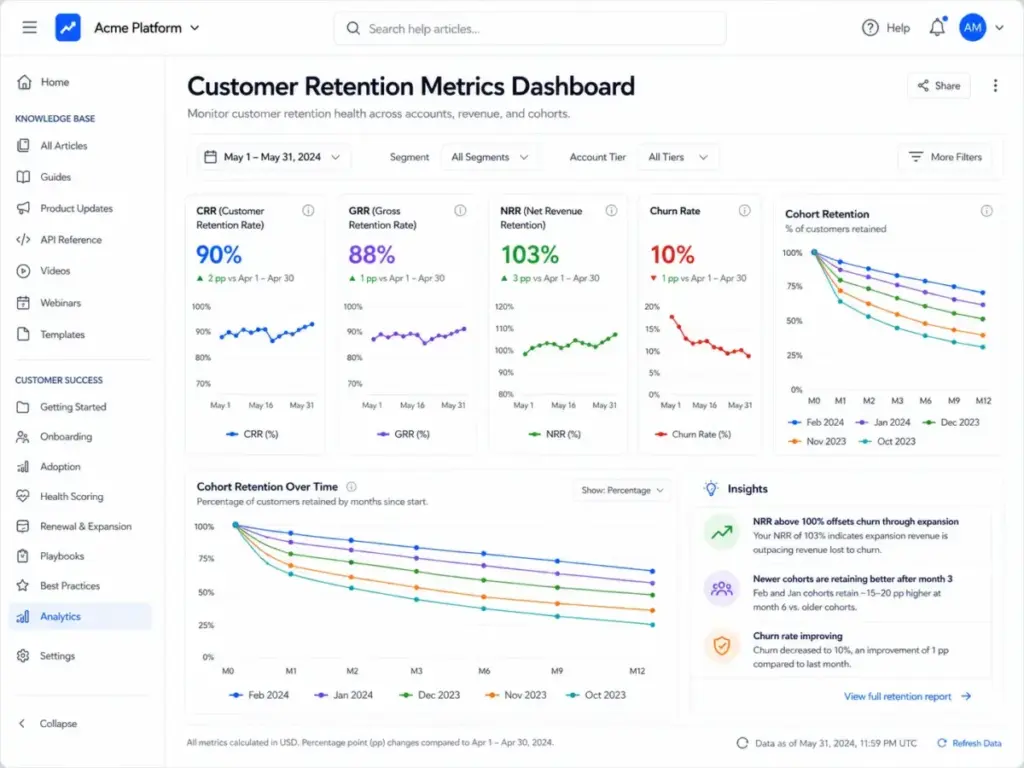
What this table means: SaaS teams should not pick one metric. CRR tells you about customer count. GRR tells you about revenue quality. NRR tells you about growth from existing customers. Usage retention tells you about product engagement. Cohort retention tells you about acquisition quality. Each answers a different question, and each metric can look healthy while others deteriorate.
What Good Customer Retention Looks Like: Software Examples
These five platforms illustrate different approaches to supporting retention workflows in SaaS.
Gainsight Customer Success
Gainsight supports retention through Customer 360 views, automated playbooks, success plans, health scorecards, digital journeys, surveys, and renewal and expansion forecasting. The Renewal Center helps sales and CS teams reduce churn, identify late renewals, and use a data-science renewal likelihood score based on health and engagement signals. Gainsight publishes Essentials and Enterprise packages on its pricing page, but exact pricing requires requesting a quote. Renewal and Expansion Forecasting is an Enterprise-only feature. Buyers should also review Gainsight’s security posture and integration permissions as part of vendor due diligence, particularly for teams processing sensitive customer data through third-party platforms.
ChurnZero
ChurnZero positions itself as AI-powered customer success software for customer growth, with AI agents designed to surface risk and opportunity signals. Its automated playbooks trigger and schedule targeted customer engagements using conditional logic. ChurnZero integrates across CRM, support, product analytics, billing, and collaboration tools including Salesforce, HubSpot, Zendesk, Stripe, Snowflake, and Intercom. ChurnZero uses a demo-led buying motion; public pricing is not disclosed on its main product pages. Teams considering ChurnZero should plan for a sales-led evaluation cycle.
Totango Customer Success Platform
Totango supports retention through customer success packages, multidimensional health scores, workflows, churn intelligence, and revenue-growth workflows. The packages page lists Enterprise and Premier tiers with included practitioner seats, customer accounts, and teams. Exact pricing requires contacting sales. Extra seats, accounts, or email blocks can be added for additional fees. Totango emphasizes enterprise data complexity and flexible implementation, making it a fit for mid-market and enterprise CS teams with structured account management processes.
HubSpot Service Hub
HubSpot Service Hub supports retention through AI-powered support, omnichannel service, ticket routing, SLAs, service analytics, a customer success workspace with health scores, feedback management, knowledge base, and customer portal. Pricing starts at $0/month (free plan) with a promotional Starter price shown at $10/month per seat (new customers only, limited time) and Enterprise at $150/month per seat (as of May 2026). HubSpot connects service data with CRM, marketing, and sales data natively, reducing the integration burden for teams already in the HubSpot ecosystem. Complex configurations may require HubSpot’s partner ecosystem (6,000+ partners) for additional support.
Zendesk Suite
Zendesk supports retention through ticketing, messaging, live chat, help center, voice, AI agents, generative replies, automated resolution reporting, CSAT surveys, SLAs, and reporting. Per the pricing page (as of May 2026), Support Team starts at US$19 per agent/month billed annually, Suite Team at US$55, Suite Professional at US$115, and Suite Enterprise at US$169. Add-ons including Copilot ($50/agent), QA ($35/agent), Workforce Management ($25/agent), and Advanced Data Privacy ($50/agent) can materially increase total cost depending on required capabilities.
Retention Software Comparison
| Tool | Best for | Pricing status | Starting price | Key retention features | Main caveat |
|---|---|---|---|---|---|
| Gainsight | Enterprise CS teams with complex account portfolios | Quote-based | Not publicly disclosed | Customer 360, health scorecards, renewal forecasting, playbooks | Requires quote; enterprise implementation effort |
| ChurnZero | Mid-market CS teams wanting AI-powered automation | Demo-led | Not publicly disclosed | AI agents, automated playbooks, integrations across CRM/support/billing | No self-serve pricing; demo required |
| Totango | Enterprise teams needing multidimensional health scoring | Sales-led | Not publicly disclosed | Health scores, workflows, churn intelligence, account packages | Extra seats/accounts cost additional fees |
| HubSpot Service Hub | Teams already in HubSpot ecosystem needing service + CS | Public pricing | $0/month (free) | Omnichannel support, health scores, CS workspace, CRM integration | Promotional pricing for new customers only |
| Zendesk Suite | Support-led retention through ticket quality and CSAT | Public pricing | US$19/agent/month | Ticketing, AI agents, CSAT, SLAs, help center | Add-ons can significantly increase per-agent cost |
What this table means: Customer success platforms (Gainsight, ChurnZero, Totango) are purpose-built for retention workflows with health scoring, playbooks, and renewal management. Help desk platforms (Zendesk, HubSpot Service Hub) support retention through support quality and ticket resolution.
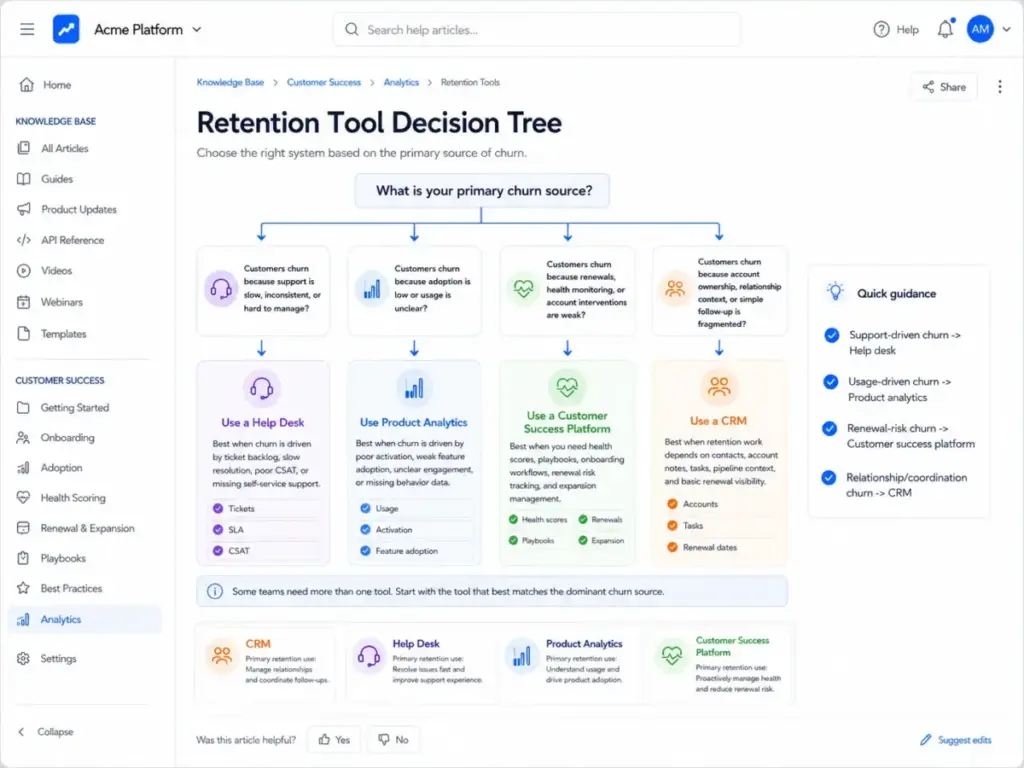
The right tool depends on whether your churn is driven by support failures (choose a help desk) or by adoption, engagement, and renewal gaps (choose a CS platform). Teams under 50 accounts often do not need a dedicated CS platform yet.
Tools That Support Customer Retention
Beyond the five platforms above, retention workflows involve tools across multiple categories. The right stack depends on your team size, churn source, and existing infrastructure.
Customer success platforms (Gainsight, ChurnZero, Totango) combine health scoring, lifecycle workflows, playbooks, and renewal visibility. G2 describes this category as software that brings together customer health monitoring, lifecycle workflows, playbooks, and renewal visibility to help teams manage onboarding, adoption, and retention. Common cost drivers include seats, customer volume, feature depth, integrations, advanced reporting, and enterprise security.
Help desk and support tools (Zendesk, HubSpot Service Hub, Freshdesk, Intercom) support retention by improving ticket resolution speed, CSAT, and support quality. If your churn analysis shows that most lost customers had unresolved support tickets, a help desk investment matters more than a CS platform.
Product analytics (Amplitude, Mixpanel, Pendo) track usage patterns, feature adoption, and behavioral retention. These tools answer the question “are customers actually using the product?” which health scores depend on.
Billing and subscription management (Stripe Billing, ChartMogul) track MRR, churn, contraction, and expansion at the revenue level. They detect failed payments and involuntary churn before it shows up in retention reports.
CRM systems (Salesforce, HubSpot CRM) store account data, renewal dates, contract values, and stakeholder contacts. For teams without a dedicated CS platform, the CRM is often where retention data lives.
The mistake I see most often: buying a CS platform before understanding where churn comes from. If your churn is caused by poor support, buy a better help desk. If churn comes from low product usage, invest in product analytics. If churn comes from renewal mismanagement across a large account base, then a CS platform makes sense.
Beginner Checklist: Getting Started with Customer Retention
Use this checklist as a starting point. Copy it, adapt it, and revisit it quarterly.
- [ ] Define what “customer” means for your retention measurement (account, user, workspace, subscription)
- [ ] Calculate your current logo retention rate using the CRR formula
- [ ] Calculate GRR and NRR for the last 4 quarters
- [ ] Identify your top 3 churn reasons from exit surveys, cancellation data, or CS notes
- [ ] Segment customers into at least 3 tiers by value (high, mid, low)
- [ ] Map the onboarding completion rate and time-to-value for new customers
- [ ] Build a basic health score with 4-6 weighted inputs (usage, support, onboarding, billing, sentiment, renewal date)
- [ ] Create one playbook for your most common churn pattern
- [ ] Assign retention ownership: who monitors health scores, who runs playbooks, who owns renewals
- [ ] Set a quarterly review cadence for cohort retention and playbook effectiveness
- [ ] Identify which tool category addresses your primary churn source before buying a CS platform
- [ ] Document what “good retention” looks like for your business (target CRR, GRR, NRR)
FAQ
What is a good customer retention rate for SaaS?
A good logo retention rate for SaaS depends on segment and contract type. SaaS Capital’s 2026 benchmark reports median gross revenue retention of 91% for bootstrapped SaaS companies with $3M to $20M ARR. Enterprise SaaS with annual contracts typically targets 90%+ logo retention and 95%+ GRR. SMB SaaS with monthly contracts often sees higher churn and may target 85-90% logo retention. The right target depends on your average contract value, sales cycle, and customer segment.
How do you calculate customer retention rate?
The standard customer retention rate formula is: CRR = ((E minus N) / S) x 100, where E is customers at the end of the period, N is new customers acquired during the period, and S is customers at the start. For example, if you start with 200 customers, acquire 40 new ones, and end with 215, your CRR is ((215 minus 40) / 200) x 100 = 87.5%. Some CX teams use an active-customer or average-customer variant, so define your cohort consistently before comparing benchmarks.
What is the difference between customer retention and customer churn?
Retention and churn are inverse measurements of the same phenomenon. If your retention rate is 92%, your churn rate is 8%. Retention measures who stayed; churn measures who left. Both can be calculated at the logo level (customer count) or revenue level (MRR or ARR lost). Teams often track both because churn rate makes the loss tangible while retention rate frames the base that remains.
Is customer retention the same as customer success?
No. Customer success is a discipline, a team function, and a set of practices focused on helping customers achieve their desired outcomes. Customer retention is the measurable result of multiple functions working together: sales, onboarding, product, support, CS, and billing. A strong CS program contributes to retention, but retention also depends on product quality, pricing fairness, support responsiveness, and market conditions that CS alone cannot control.
What signals show a SaaS customer is at risk before they cancel?
Common early warning signals include declining login frequency, stalled onboarding (setup not completed after 21+ days), rising unresolved support tickets, champion departure or role change, failed payments, fewer feature interactions over time, negative survey responses, downgrade inquiries, no executive sponsor, and silence (no engagement with CS, support, or product for 30+ days). Building these signals into a health score and connecting them to intervention playbooks is how teams catch at-risk accounts before cancellation.
What is the difference between logo retention and revenue retention?
Logo retention counts how many customer accounts stayed, regardless of what they pay. Revenue retention measures how much recurring revenue stayed. A company can have 95% logo retention (lost only 5% of accounts) but 82% gross revenue retention if the lost accounts were disproportionately large. Revenue retention comes in two forms: GRR (before expansion) and NRR (after expansion). SaaS teams need both views because each reveals different problems.
Do customer health scores actually predict churn?
Health scores predict churn only if the inputs are weighted based on actual churn correlation data and the scores trigger interventions. A health score built on arbitrary weights or one that sits in a dashboard without connected playbooks adds no predictive value. The best health scores combine product usage signals, support interaction patterns, onboarding completion, commercial data, and sentiment. Review and recalibrate weights quarterly based on which signals most accurately predicted recent churn events.
Should I focus on retention or acquisition first?
Both matter, but the sequence depends on your current metrics. If your GRR is below 80%, fixing retention is more urgent because new customers are replacing churned customers rather than growing the base. If your GRR is above 90% and your growth rate is below target, acquisition investment has a higher marginal return. The breakpoint: when your sales funnel is producing customers who stay, scale acquisition. When it is producing customers who churn, fix retention first.
Which tools track churn risk and renewals?
Dedicated customer success platforms (Gainsight, ChurnZero, Totango) track churn risk through health scores, renewal timelines, and automated playbooks. Help desk tools (Zendesk, HubSpot Service Hub) track support-related risk through ticket volume and CSAT. Product analytics tools (Amplitude, Mixpanel) track usage-based risk. Billing platforms (Stripe, ChartMogul) track revenue churn and failed payments. Most teams need at least two of these categories working together; the right combination depends on your primary churn source.
When does retention investment become counterproductive?
Retention investment becomes counterproductive when you are spending more to retain a customer than the customer generates in revenue and expansion potential. This happens with poor-fit accounts (they bought the product for the wrong use case), high-support-burden accounts (15+ tickets/month on a $300/month subscription), accounts that will never expand beyond their current tier, and accounts that distort product roadmap priorities. Letting these accounts churn frees capacity for customers who fit and grow.