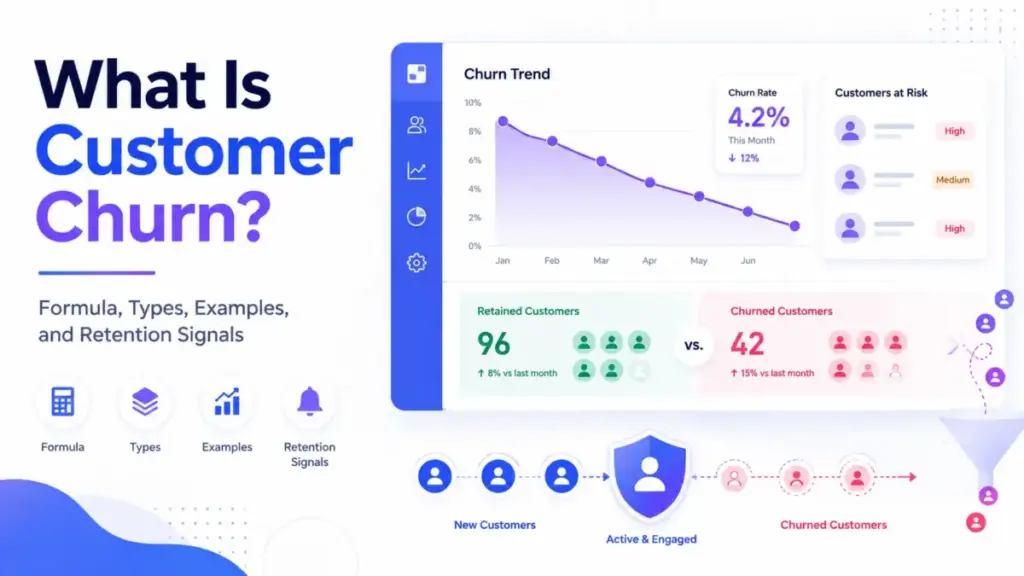
Customer churn measures something most SaaS teams talk about daily but define inconsistently: how many paying customers stopped being paying customers during a specific period. The formula looks simple. Divide customers lost by customers at the start of the period, multiply by 100.
The real complexity shows up when teams disagree on what counts as “lost,” whether free trials belong in the denominator, and whether losing one enterprise account matters more than losing ten starter plans.
I have spent years evaluating CRM platform options and customer success tools across organizations ranging from 5-person startups to 200-seat sales teams. The pattern is consistent: companies that treat churn as a single percentage end up chasing the wrong problems. The ones that separate customer loss from revenue loss, voluntary exits from payment failures, and onboarding failures from product-fit issues build retention systems that actually work.
This guide explains what customer churn means, how to calculate it correctly, which churn types require different responses, and when you need specialized tooling to move from reactive cancellation tracking to proactive customer retention.
Quick Answer: Customer churn is the percentage of existing paying customers who cancel, do not renew, or stop doing business with a company during a defined period. The standard formula divides customers lost during the period by customers at the start of the period, then multiplies by 100. It differs from revenue churn, which measures lost recurring revenue and can tell a sharper story when account sizes vary.
The 60-Second Explanation of Customer Churn
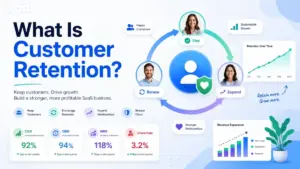
Customer churn (also called logo churn or customer attrition) counts the customers a business loses over a set timeframe. IBM defines it as “the number of existing customers lost, for any reason at all, over a given period of time.” Maxio expands the definition to include cancellations, non-renewals, and inactive accounts.
That is the simple layer. Here is the technical layer: for SaaS, the cleanest customer churn calculation counts only paying customers, excludes free trials and free-plan users, uses customers at the start of the period as the denominator, and adjusts for same-period reactivations and same-period join-and-cancel cases. ChartMogul’s customer churn rate methodology recommends these adjustments to prevent formula skew.
And the business layer: customer churn is one half of a retention picture. It answers “how many customers did we lose?” but not “how much revenue did we lose?” or “which customers are about to leave?” Boards, investors, and revenue leaders care about churn because it directly affects recurring revenue forecasts, customer lifetime value calculations, and whether acquisition spending fills or leaks the customer base.
A company with 3% monthly customer churn loses roughly 31% of its customer base over 12 months (compounded). That number changes everything about growth math.
Customer Churn vs Revenue Churn vs Retention Metrics
| Metric | What it measures | When to use it | Key difference |
|---|---|---|---|
| Customer churn rate | Percentage of customers lost | When you need to understand customer-base durability | Counts logos, not dollars |
| Revenue churn (gross) | MRR or ARR lost from cancellations and downgrades | When account values vary widely | One enterprise cancel can outweigh ten starter cancels |
| Net revenue churn | Lost revenue minus expansion revenue from remaining customers | When expansion is material | Can go negative if upsells exceed losses |
| Gross Revenue Retention (GRR) | Revenue kept from existing customers, excluding expansion | Board-level revenue quality assessment | Never exceeds 100% |
| Net Revenue Retention (NRR) | Revenue from existing customers including expansion | Investor-level growth quality | Exceeds 100% when expansion outpaces losses |
| Customer retention rate | Percentage of customers kept (inverse of churn) | When framing churn positively | 100% minus customer churn rate |
What this means: A SaaS company with 5% monthly customer churn but only 2% revenue churn is losing many small accounts while retaining large ones. The opposite pattern, low customer churn with high revenue churn, signals enterprise contraction or downgrades, which is often more dangerous.
How Customer Churn Actually Works
The basic formula is straightforward:
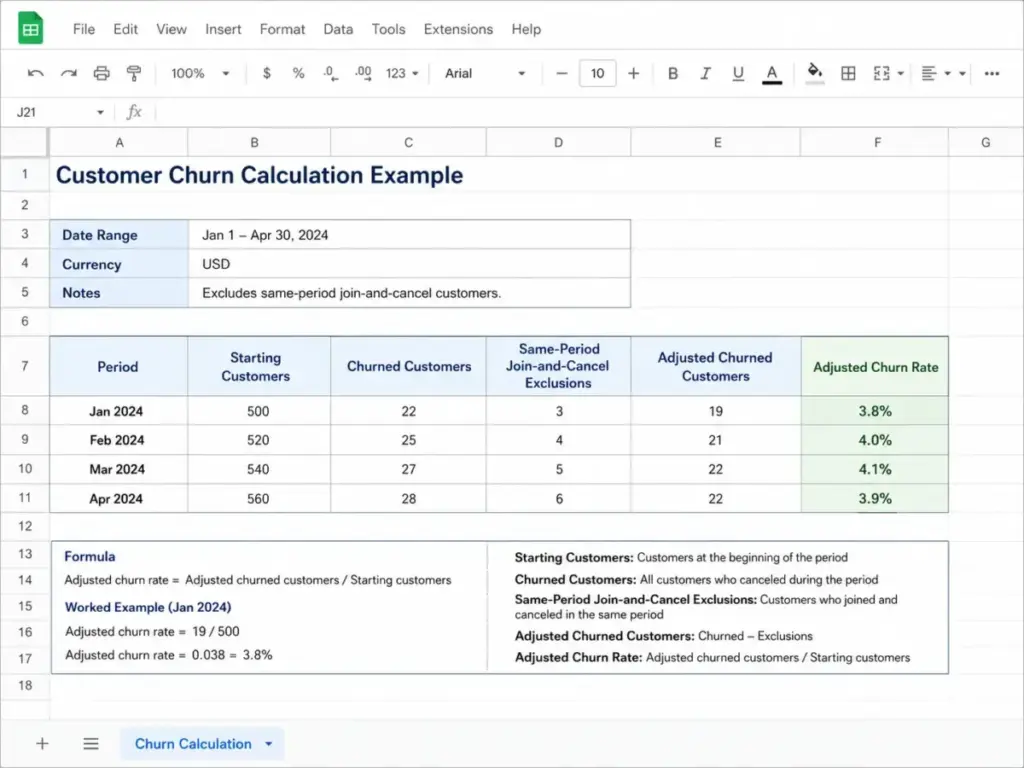
Customer Churn Rate = (Customers Lost During Period / Customers at Start of Period) x 100
A company starting the month with 500 customers and losing 20 has a 4% monthly customer churn rate. But the formula hides several calculation decisions that change the number.
Calculation Edge Cases Most Articles Skip
Free trials and freemium users. For SaaS customer churn, count paying customers only unless you explicitly label the metric as “user churn” or “activation churn.” Including free trial users who never converted inflates the churn number and obscures the real retention signal.
Same-period joins and cancels. A customer who signs up on March 5 and cancels on March 28 was not part of your March 1 starting base. Including them in the numerator (lost customers) without including them in the denominator (starting customers) distorts the rate. ChartMogul recommends adjusting the churned count to exclude same-period joiners, or tracking them separately as “early-life churn.”
Reactivations. If a customer cancels in February but reactivates in March, counting them as churned in February and new in March double-counts the movement. Consistent treatment matters more than which specific method you choose.
Monthly vs annual measurement. Self-serve SaaS products with monthly contracts benefit from monthly churn tracking. Enterprise products with annual contracts need quarterly or annual measurement. A 5% annual churn rate is strong for enterprise. A 5% monthly churn rate compounds to 46% annual loss, which is unsustainable.
Types of Customer Churn and Who Owns Each One
Not all churn responds to the same intervention. Treating every cancellation the same way wastes resources and misdiagnoses root causes. Here are the eight churn types SaaS teams should classify separately.
| Churn type | What happens | Primary owner | Response |
|---|---|---|---|
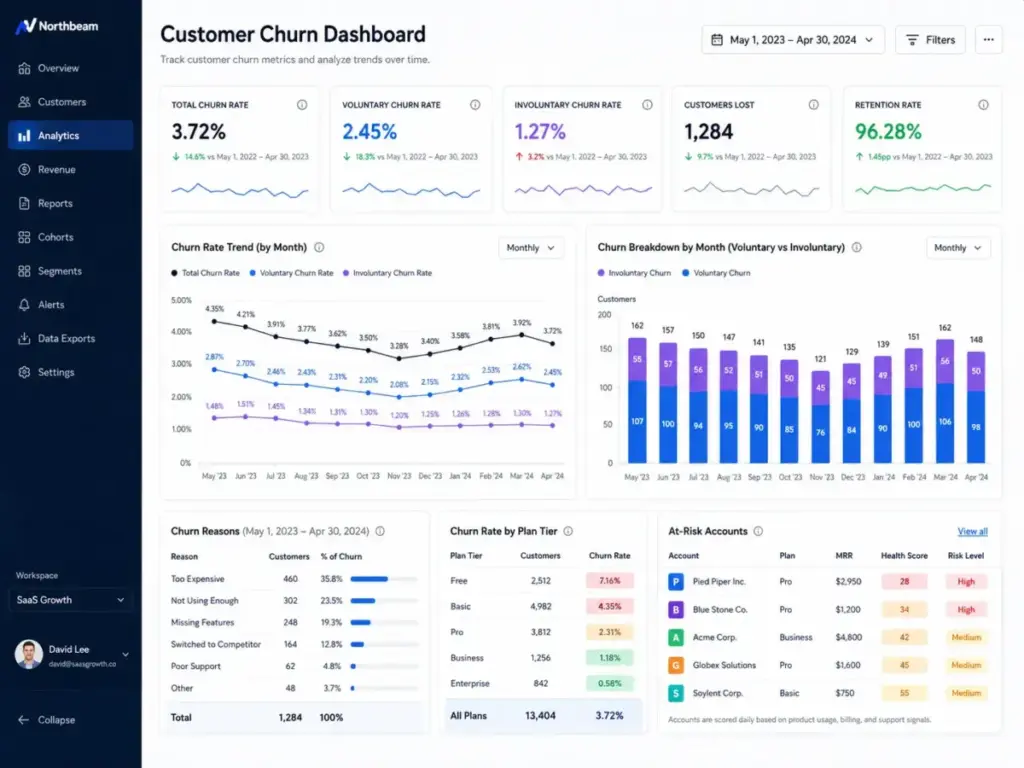
| Voluntary churn | Customer actively cancels due to poor fit, weak adoption, or competitive switch | Customer Success + Product | Exit interviews, adoption campaigns, success plans |
| Involuntary churn | Customer lost to failed payments, expired cards, or billing errors | Finance + Billing | Dunning workflows, card updaters, payment retry logic |
| Early-life churn | Customer cancels within first 30-90 days | Onboarding + Product | Activation milestones, onboarding nudges, time-to-value tracking |
| Revenue churn (contraction) | Customer downgrades to a lower plan | Product + Pricing | Value demonstration, feature adoption, pricing review |
| Wrong-fit churn | Customer was never a good fit (wrong ICP, overpromised by sales) | Marketing + Sales | ICP refinement, qualification criteria, expectation alignment |
| Happy churn | Customer leaves after completing a temporary or seasonal goal | Product + Strategy | Seasonal re-engagement, expanded use cases |
| Competitive churn | Customer switches to a competitor | Product + CS + Marketing | Win-loss analysis, competitive positioning, feature roadmap |
| Consolidation churn | Customer merges tools as part of a platform consolidation | CS + Sales | Expansion into adjacent use cases, integration value |
What this means: Involuntary churn is a billing operations problem, not a customer success problem. Wrong-fit churn originates in marketing and sales, not in the product. Treating all churn as a CS responsibility, which is what many organizations do, means the team closest to the customer gets blamed for problems created upstream.
The Mistakes That Cost Your First Quarter
Mistake 1: Mixing customer churn and revenue churn
These metrics answer different questions. A company losing ten $50/month accounts (customer churn: 2%) while losing one $5,000/month account (revenue churn: 10%) faces a revenue problem that customer churn alone hides. Track both. Report both. Discuss both in monthly reviews.
Mistake 2: Using end-of-period customers as the denominator
Some teams divide lost customers by end-of-period customers. This produces a different number than start-of-period, and the two are not interchangeable without explicit labeling. Pick one method, document it, and use it consistently.
Mistake 3: Benchmarking against unrelated SaaS segments
ChartMogul’s benchmark data shows that median monthly customer churn varies sharply by company stage and ARPA band. Companies under $300K ARR see median monthly churn around 6.5%. Companies above $8M ARR see closer to 3.1%. Comparing an early-stage, low-ARPA, self-serve product against enterprise SaaS benchmarks produces misleading conclusions.
Mistake 4: Ignoring involuntary churn
Payment failures, expired credit cards, and billing errors account for a meaningful share of total churn. Mercury and other fintech sources note that involuntary churn is a billing workflow issue that responds to dunning sequences, card updater services, and retry logic, not to customer success outreach.
Mistake 5: Treating churn as a lagging metric only
By the time a customer cancels, the retention opportunity passed weeks or months earlier. Declining product usage, rising support tickets, negative survey responses, payment failures, and champion departures are all leading indicators that surface churn risk before cancellation.
Mistake 6: Letting health scores become vanity dashboards
Customer health scores fail when they rely on meeting activity, CSM gut feel, or NPS alone. Effective scores weight product usage, activation milestones, support friction, renewal timing, payment health, and value outcomes.
Common Misconceptions About Customer Churn
Misconception: Customer churn and revenue churn are interchangeable. Reality: They measure different things. Customer churn counts lost accounts. Revenue churn measures lost recurring revenue and can reveal a more serious financial problem even when fewer customers leave.
Misconception: All churn is equally bad. Reality: Voluntary churn, involuntary churn, wrong-fit churn, and happy churn require different actions. Some churn signals a product problem. Some signals a payment workflow issue. Some signals that the customer completed their goal.
Misconception: A good churn benchmark applies to every SaaS company. Reality: Benchmarks depend on company stage, ARPA, customer segment, contract length, sales pipeline motion, and product category. A number that signals health for an enterprise product signals crisis for a self-serve tool.
Misconception: Churn is owned only by customer success. Reality: Churn causes span marketing fit, sales expectations, onboarding quality, product value, pricing structure, billing reliability, support responsiveness, and executive alignment. Cross-functional ownership produces better retention outcomes.
Misconception: A high customer health score always means low churn risk. Reality: Health scores mislead when they rely on vanity engagement metrics, meeting frequency, or CSM judgment rather than value realization and product adoption outcomes.
When to Use and When to Avoid Customer Churn Rate
Track customer churn when:
- You need to understand customer-base durability and retention health
- You want to assess product-market fit across customer segments
- You need to forecast recurring revenue and customer lifetime value
- You want to expose onboarding, adoption, support, or pricing problems
- Boards and investors ask about retention quality
Do not rely on customer churn alone when:
- Account values vary widely (pair with revenue churn and GRR)
- Expansion revenue is material (pair with NRR)
- Usage-based pricing dominates your revenue model
- Free users are mixed with paying customers in your data
- You need to forecast valuation or revenue quality for fundraising
How to Spot Churn Risk Before Cancellation
A cancellation survey tells you why customers left. Leading indicators tell you which customers are about to leave. Here is a health score checklist that prioritizes predictive signals over vanity metrics.
Churn Risk Signal Checklist
- Login frequency declining over 2+ consecutive weeks
- Core feature usage dropping below activation threshold
- Support ticket volume increasing without resolution
- NPS or CSAT response turning negative
- Payment failures or overdue invoices
- Primary champion or decision-maker changed roles
- Renewal conversation silence (no engagement 60+ days before renewal)
- Product adoption stalled at onboarding stage
- Customer stopped attending QBRs or check-ins
- Competitive evaluation signals (integration with competitor tools)
Implementation Steps
- Define what counts as a churned customer: cancellation, non-renewal, inactivity, failed payment, or account closure
- Choose the measurement period: monthly for self-serve, quarterly or annual for enterprise
- Use customers at the start of the period as your denominator
- Exclude free trials and freemium users unless you label the metric separately
- Calculate customer churn and revenue churn independently
- Segment churn by cohort, plan tier, ARPA, and acquisition source
- Classify churn reasons into voluntary, involuntary, wrong-fit, onboarding failure, competitive, and happy churn
- Build leading indicator dashboards using the signals above
- Create intervention playbooks for each churn type
- Review churn monthly with product, CS, sales, marketing, finance, and support, not just CS alone
What Good Churn Management Looks Like: Real-World Examples
These five tools represent different approaches to measuring, predicting, and reducing churn. None is a universal answer. Each fits a specific part of the churn workflow.
Gainsight: Enterprise Customer Success Platform
Gainsight provides Customer 360 views, playbooks, success plans, dashboards, and health scorecards. It includes renewal and expansion forecasting alongside survey and digital journey tools. Gainsight fits enterprise CS teams managing hundreds or thousands of accounts. According to its pricing page, both Essentials and Enterprise plans require contacting sales for pricing, with Essentials including 10 full users and Enterprise including 20.
ChurnZero: Unified Churn Prediction
ChurnZero combines product usage, CRM, support, sentiment, and revenue data into one platform. Its ChurnScores provide a composite churn risk metric. Real-time alerts, journeys, playbooks, and renewal forecasting help CS teams intervene before cancellation. ChurnZero uses a demo-first sales model rather than public pricing.
Totango: AI-Powered Churn Intelligence
Totango offers a customer success platform alongside Unison, an AI-powered churn intelligence engine. Unison provides standard and custom churn models, health scores generated within 1-2 days of setup, risk detection, and key moment tracking. Totango integrates with CRM and CSP platforms and delivers alerts via Slack and email.
Userpilot: Product-Led Churn Prevention
Userpilot approaches churn through product analytics and in-app engagement. It identifies churn risk using behavioral segmentation, usage trends, NPS surveys, and retention analytics, then uses in-app flows and guidance to re-engage at-risk users. Userpilot fits product-led growth teams that want to prevent churn through adoption improvement rather than CSM outreach.
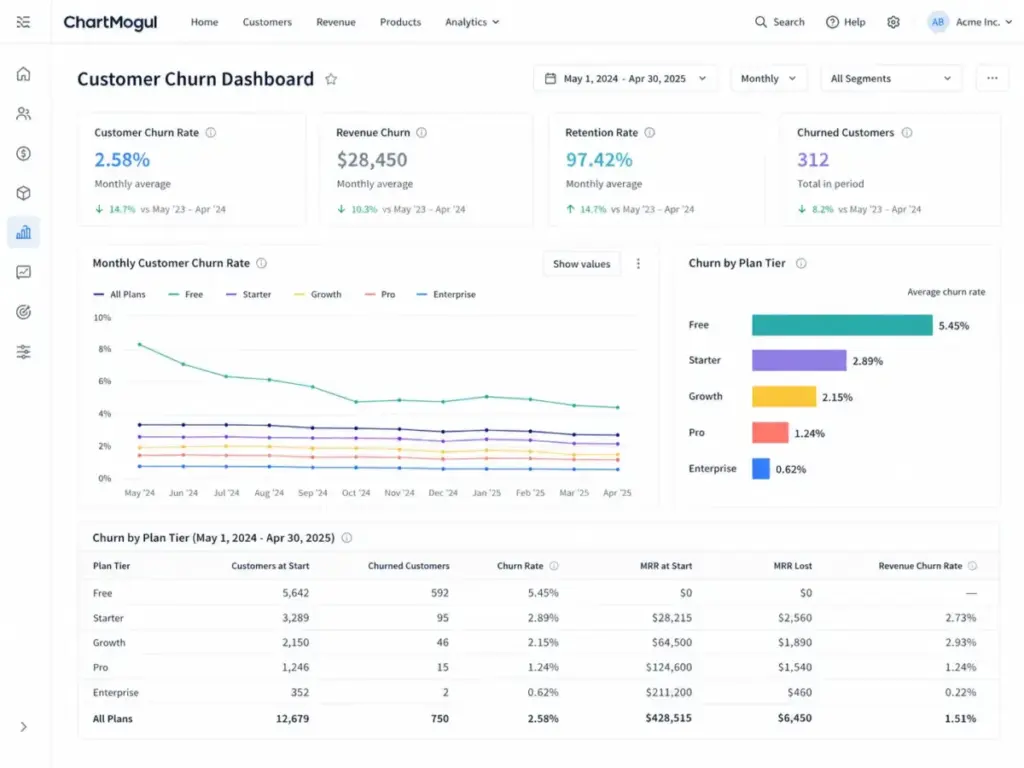
ChartMogul: Subscription Analytics and Churn Measurement
ChartMogul calculates MRR, ARR, churn, LTV, and customer movements from billing sources. It provides segmentation, custom reports, and benchmark data. ChartMogul fits SaaS finance and ops teams that need accurate churn measurement and cohort analysis without building custom dashboards.
Tools That Help Measure and Reduce Customer Churn
| Tool category | What it does for churn | Examples | Best when |
|---|---|---|---|
| Customer success platform | Manages customer health, renewals, playbooks, success plans | Gainsight, ChurnZero, Totango | CS team manages 100+ accounts with dedicated CSMs |
| Product analytics | Tracks feature adoption, usage trends, activation milestones | Userpilot, Amplitude, Mixpanel, Pendo | Product-led growth or self-serve model |
| Billing and subscription analytics | Calculates MRR, churn, LTV, cohort retention from billing data | ChartMogul, Maxio, Baremetrics, ProfitWell | Finance and ops need accurate revenue churn data |
| CX and feedback platform | Measures NPS, CSAT, CES, and sentiment across touchpoints | Qualtrics, Zendesk, HubSpot Service Hub | Support and CX teams need voice-of-customer signals |
| Billing and dunning | Recovers failed payments, retries charges, updates expired cards | Stripe Billing, Chargebee | Involuntary churn is a significant share of total churn |
What this means: No single tool covers all churn workflows. CS platforms miss billing failures. Billing tools miss adoption signals. Product analytics miss renewal timing. The right stack depends on your churn profile: if involuntary churn is high, start with dunning and billing. If voluntary churn dominates, start with product analytics or customer success.
Why Customer Churn Matters More in 2026
SaaS growth conditions shifted. As Alan Taylor, COO at Maxio, noted in the 2026 B2B Growth Report: “Growth didn’t disappear in 2025; it became harder to earn.” Maxio’s data shows 35% of SaaS companies declined year over year despite average growth across the market.
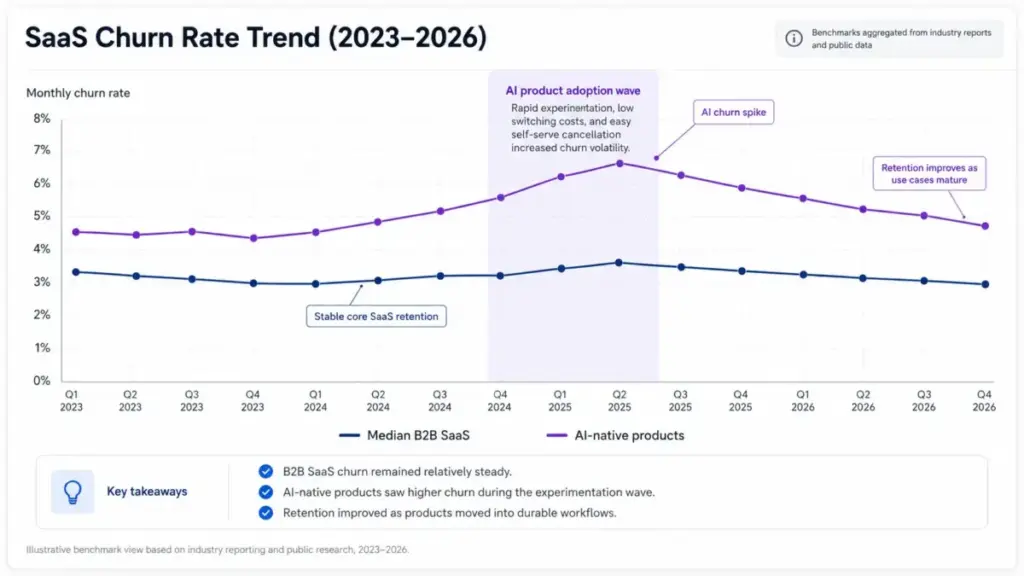
The emergence of AI and self-serve products adds a new churn dynamic. Kyle Poyar, analyst at ChartMogul, described the pattern in their SaaS Retention Report: “The downside of being easy to buy is being easy to cancel.” When customers adopt AI tools experimentally, with low switching costs and trial-like paid usage, retention becomes less automatic. Self-serve revenue that arrives quickly can leave just as quickly.
This is why churn measurement is shifting from a monthly dashboard check to an operational system. Teams that separate voluntary from involuntary churn, track customer lifecycle leading indicators, segment by cohort and value, and own churn cross-functionally have a structural advantage over teams that report a single percentage once a quarter.
Beginner Checklist: Getting Customer Churn Tracking Right
- Define “churned customer” explicitly for your business (cancellation, non-renewal, inactivity, or payment failure)
- Choose a consistent measurement period (monthly for self-serve, quarterly for enterprise)
- Use customers at the start of the period as your denominator
- Exclude free trials and freemium users from paying customer churn
- Track customer churn and revenue churn separately
- Classify churn as voluntary, involuntary, early-life, or wrong-fit
- Build at least 5 leading indicators before relying on cancellation surveys
- Segment churn by cohort, plan tier, ARPA, and acquisition source
- Review churn cross-functionally, not as a CS-only metric
- Set up a dunning workflow for involuntary churn recovery
- Document your methodology so the metric is comparable across quarters
FAQ
What is customer churn?
Customer churn is the number or percentage of existing paying customers who stop doing business with a company during a defined period. It includes cancellations, non-renewals, and account closures. The standard formula divides customers lost during the period by customers at the start of the period, then multiplies by 100.
How do you calculate customer churn rate?
Divide the number of customers lost during a period by the total customers at the start of that period, then multiply by 100. For example, if you start April with 1,000 customers and lose 40, your monthly customer churn rate is 4%. Exclude free trial users unless you label the metric as user churn.
What is a good customer churn rate for SaaS?
It depends on company stage, ARPA, and customer segment. ChartMogul benchmark data shows median monthly customer churn of approximately 6.5% for companies under $300K ARR and 3.1% for companies above $8M ARR. No single benchmark applies universally.
What is the difference between customer churn and revenue churn?
Customer churn counts lost accounts. Revenue churn measures lost recurring revenue from cancellations and downgrades. A company can have low customer churn but high revenue churn if large accounts leave or downgrade. Revenue churn is often the more financially meaningful metric.
Should free trial users count in churn calculations?
For standard customer churn, no. Free trial users who never converted to paying customers were not part of the paying customer base. Including them inflates the churn rate and obscures the real retention signal. Track trial conversion rates separately.
What is involuntary churn?
Involuntary churn occurs when customers are lost due to payment failures, expired credit cards, billing errors, or account suspensions rather than a deliberate decision to cancel. It responds to dunning workflows, payment retry logic, and card updater services, not to customer success outreach.
What causes customer churn in SaaS?
Common causes include poor product-market fit, weak onboarding and activation, unmet expectations set during sales, pricing that does not match perceived value, missing features, competitive alternatives, payment failures, lack of support responsiveness, and champion or decision-maker turnover.
How do I separate voluntary from involuntary churn?
Tag each churn event by cause at the time of cancellation. Payment failures and expired cards are involuntary. Active cancellations, non-renewals after outreach, and downgrades to free plans are voluntary. Most billing platforms (Stripe, Chargebee) and CS platforms (ChurnZero, Gainsight) support this classification.
What is the difference between gross churn and net churn?
Gross churn counts total customer or revenue loss without offsetting expansion. Net churn subtracts expansion revenue (upsells, cross-sells, seat additions) from gross losses. Net revenue churn can become negative when expansion from existing customers exceeds revenue lost to cancellations and downgrades.
What churn metrics do investors ask for?
Investors typically ask for monthly or annual customer churn rate, gross revenue churn, net revenue retention (NRR), and gross revenue retention (GRR). NRR above 100% signals that existing customers generate growth. GRR above 85-90% signals revenue durability. Logo churn without revenue context is less informative for fundraising conversations.