Every project manager has stared at a spreadsheet full of tasks and thought: “I have no idea what depends on what, who is blocked, or whether we will hit the deadline.” A Gantt chart is the tool that is supposed to fix that.
It plots tasks against a timeline, connects them with dependency logic, and shows the entire schedule in one view. But most definitions stop at “horizontal bars on a calendar” and skip the part that actually matters: how dependency lines, ownership, update cadence, and baseline tracking turn a static timeline into a working schedule.
This guide covers how a Gantt chart works in practice, when it helps, when it creates false precision, and which project management tools support real scheduling versus just drawing bars.
Quick Answer: A Gantt chart is a project scheduling visual that lists tasks on one axis and time on the other, using horizontal bars to show each task’s start date, finish date, and duration. Modern Gantt charts add dependency links, milestones, task owners, progress shading, baselines, and critical path views. The value comes from dependency logic and update discipline, not just from the bars.
The 60-Second Explanation of a Gantt Chart
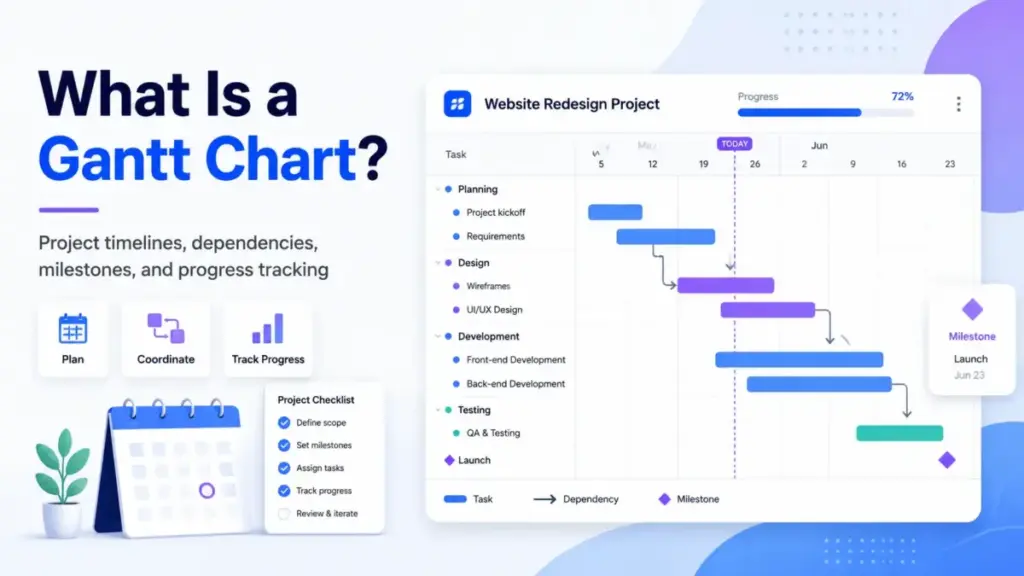
For beginners: A Gantt chart is a bar chart for project schedules. Each row is a task or deliverable. Each bar shows when that task starts, how long it takes, and when it ends. You read left to right across a calendar.
For practitioners: A Gantt chart combines a work breakdown structure with a time-scaled schedule. Tasks sit in rows, grouped by phase or workstream. Horizontal bars map planned start and finish dates. Dependency arrows connect tasks: finish-to-start, start-to-start, finish-to-finish, and start-to-finish. Milestones mark zero-duration checkpoints (approvals, launches, handoffs). The Association for Project Management defines it as “a graphical representation of activity against time” that “helps project professionals monitor progress.”
For decision-makers: A Gantt chart answers three questions at a glance: Are we on track? What is blocking us? If this task slips, what else moves? Teams that rely on scattered spreadsheets, chat threads, and status meetings lose visibility as projects scale. A shared Gantt schedule connects tasks, owners, milestones, and dependencies in one view, which reduces status-meeting overhead and surfaces deadline risk before it becomes a crisis.
How a Gantt Chart Actually Works
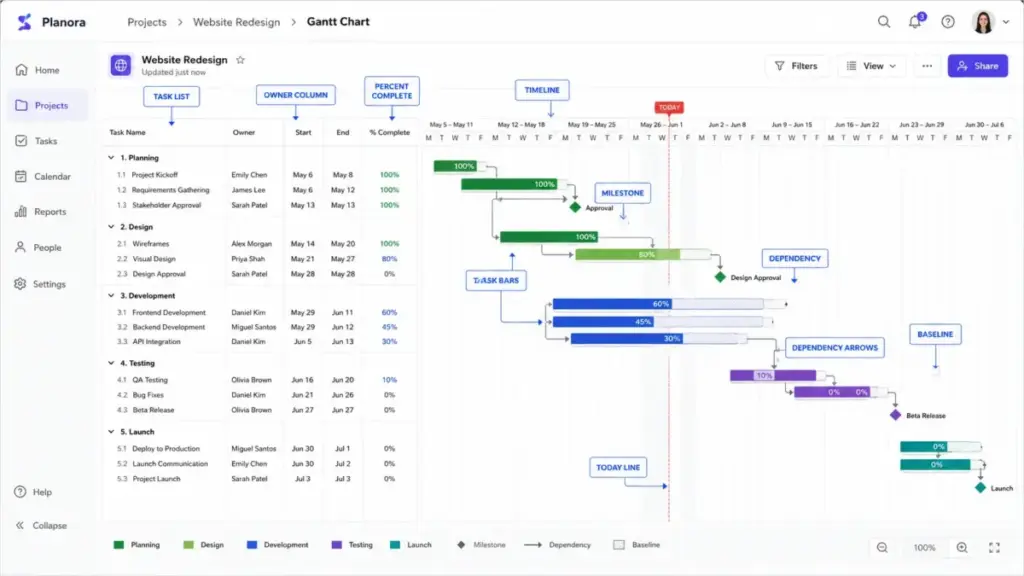
A Gantt chart starts with a task list. Each task gets a row, a start date, an end date, and an owner. The timeline runs along the top. But the scheduling logic, the part most beginner guides skip, lives in the dependency connections.
The dependency layer
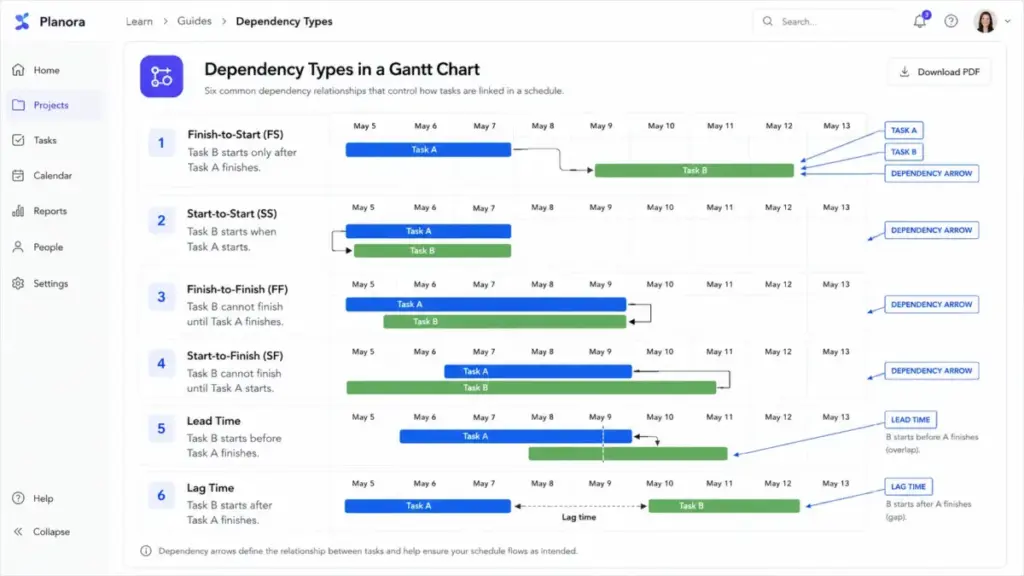
Dependency arrows tell the schedule engine which tasks must finish or start before others can move. Four types exist:
| Dependency Type | What It Means | Example |
|---|---|---|
| Finish-to-Start (FS) | Task B cannot start until Task A finishes | Design must finish before development starts |
| Start-to-Start (SS) | Task B cannot start until Task A starts | Testing starts when coding starts |
| Finish-to-Finish (FF) | Task B cannot finish until Task A finishes | Documentation finishes when the feature finishes |
| Start-to-Finish (SF) | Task B cannot finish until Task A starts | Rare; used in just-in-time workflows |
Lead and lag time adjust the gap between linked tasks. Microsoft Project supports all four dependency types with lead and lag, while some lighter tools only support finish-to-start.
Critical path
The critical path is the longest chain of linked tasks that determines the project finish date. If any task on the critical path slips, the project deadline slips. According to Microsoft’s Project documentation, “the critical path is a chain of linked tasks that directly affects the project finish date.” Identifying it helps project managers focus attention on the tasks that carry the most schedule risk.
Milestones and baselines
Milestones are zero-duration markers for approvals, phase gates, launches, or client deadlines. Baselines save a snapshot of the original schedule so teams can compare planned versus actual progress. Without a baseline, the chart drifts silently and nobody notices the slippage until it is too late.
Where it breaks
A Gantt chart fails when the team builds it and then stops updating it. Dependencies go stale, progress bars lie, and the chart becomes a presentation artifact instead of a planning instrument.
Gantt Chart vs Timeline vs Kanban vs Roadmap
One of the gaps in most Gantt chart definitions is the failure to separate a Gantt chart from a simple timeline. A timeline shows when work happens. A Gantt chart shows what depends on what, what slips if a task moves, and which milestone is at risk.
| Planning View | Primary Question | Best For | Weakness |
|---|---|---|---|
| Timeline | When does work happen? | Simple scheduling, stakeholder overviews | No dependency logic |
| Gantt chart | What depends on what, and what is at risk? | Deadline-driven projects with sequencing | Maintenance burden, false precision |
| Kanban board | What is in progress right now? | Daily workflow, ad hoc tasks, WIP limits | No date-based scheduling |
| Roadmap | Where are we heading this quarter? | Strategic communication, product direction | Too high-level for execution |
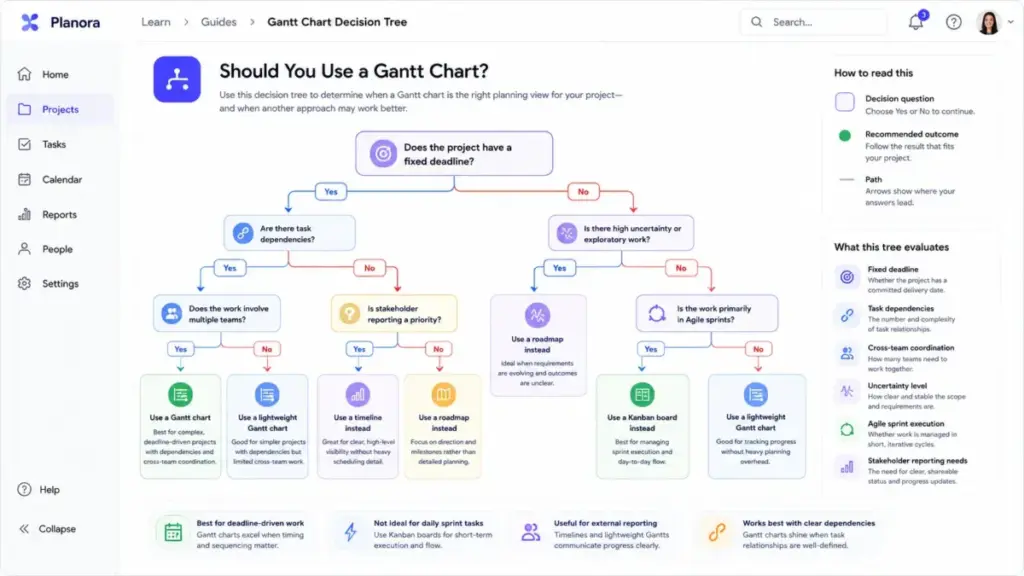
The practical distinction: if your project has hard deadlines, cross-functional handoffs, and tasks that block other tasks, a Gantt chart adds scheduling intelligence that a timeline or Kanban board cannot provide. If your work is backlog-driven and dates are flexible, a board or roadmap is usually the better fit.
Step-by-Step: How to Build and Maintain a Gantt Chart
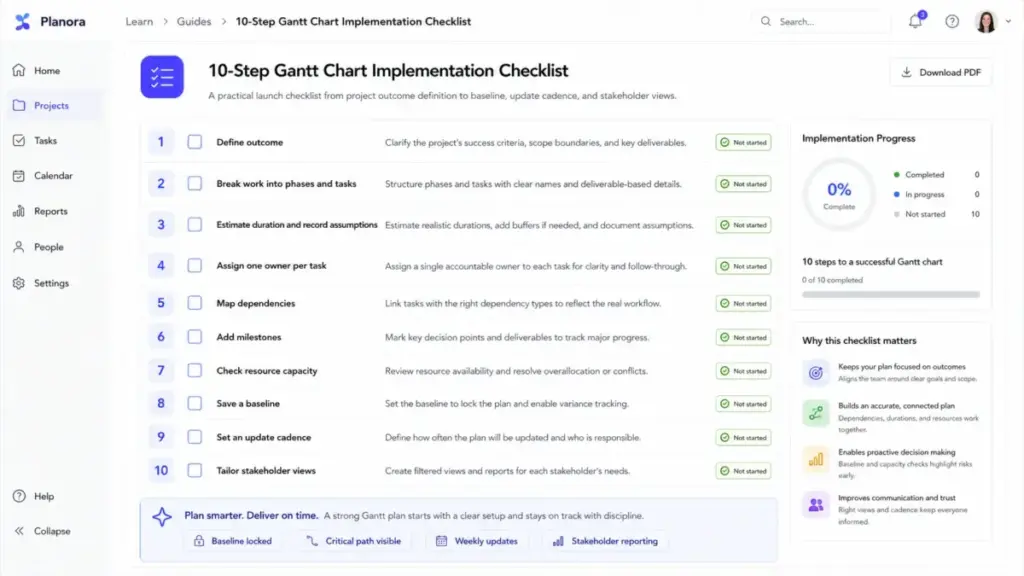
Step 1: Define the outcome
Name the project, the final deliverable, the deadline, and the decision owner.
Step 2: Break work into phases and tasks
Group tasks under phases using a work breakdown structure. Do not turn every 15-minute action into a row.
Step 3: Estimate duration and record assumptions
Assign duration to each task. Document what the estimate assumes (availability, scope, external dependencies). Estimates without documented assumptions become false confidence.
Step 4: Assign one owner per task
Every task needs a single accountable person. “The team” as owner means nobody owns it.
Step 5: Map dependencies and add milestones
Link dependent tasks with finish-to-start connections at minimum. Insert milestones for approvals, handoffs, launches, and external commitments.
Step 6: Check capacity and save a baseline
Two tasks assigned to the same person in the same week look feasible on the chart but fail in practice. Review workload before publishing. Save the original schedule as a baseline to measure variance.
Step 7: Update weekly, tailor views by audience
Stale charts create false confidence. Update progress weekly, review the critical path, and confirm blockers. Filter views by audience: executives see milestones, team members see assigned tasks and upstream dependencies, and clients see deliverables and approval dates.
The Mistakes That Waste Your First Month
Building the Gantt before defining scope. Without scope, the chart is fiction.
Adding too much task detail. Fifty sub-tasks under one phase makes the chart unreadable. Keep it at the level where dependencies and ownership matter.
Using exact dates for uncertain work. PMI’s Disciplined Agile framework recommends ranges over exact dates where precision is misleading.
Ignoring dependencies. Tasks without links are just a pretty list.
Failing to update progress. A Gantt chart nobody updates becomes a presentation slide, not a planning tool.
Not assigning owners. Unowned tasks create accountability gaps.
Using a Gantt chart for ad hoc work. Support tickets and backlog-driven sprints do not benefit from date-bar scheduling. Use a Kanban board instead.
Hiding resource constraints. The chart looks feasible while three people are triple-booked.
Choosing a tool without checking feature gates. Some SaaS products gate dependency types, critical path, and baselines behind higher-tier plans.
Common Misconceptions About Gantt Charts
Misconception: A Gantt chart is just a timeline.
A timeline shows work over time. A Gantt chart adds task breakdown, duration, dependencies, milestones, ownership, progress, and sometimes critical path or baseline logic. The dependency layer is what separates a schedule from a visual.
Misconception: A Gantt chart guarantees on-time delivery.
It only makes the schedule visible. Teams still need realistic estimates, active updates, resource planning, and decision-making when risk appears.
Misconception: Agile teams should never use Gantt charts.
Agile teams should not micromanage sprint tasks with Gantt charts. But a lightweight release-level Gantt can communicate cross-team dependencies and external milestones. In online project management forums, practitioners report that a simplified Gantt helped visualize dependencies between Scrum teams during a platform upgrade. The key: keep it high-level and do not use it as a sprint task tracker.
Misconception: The more detailed the Gantt chart, the better.
Too much detail makes the chart hard to maintain and hard to read. The useful level of detail depends on the audience and the planning horizon.
Misconception: Excel Gantt charts are equivalent to SaaS Gantt tools.
Excel can simulate a basic Gantt bar chart. It lacks native dependency recalculation, collaboration, automated alerts, baselines, and critical path behavior unless heavily customized. For projects with real sequencing needs, a dedicated tool saves significant time.
When to Use a Gantt Chart and When to Avoid One
Use a Gantt chart when:
- The project has a fixed deadline with multiple phases
- Tasks depend on each other and delays cascade
- Cross-functional handoffs require sequencing
- External dependencies or client milestones need visibility
- Stakeholders need a visual schedule for reporting
- Resource conflicts affect delivery timing
Avoid or keep it lightweight when:
- Work is exploratory, rapidly changing, or backlog-driven
- The project is purely personal or not date-bound
- Daily tasks are better managed with a checklist or Kanban board
- The team does not have the discipline to update the chart regularly
- A roadmap or issue tracker serves the purpose
Paul Koetke, a Smartsheet Platinum Partner, said it well: “I always start by looking at the critical path first, that red line tells me immediately where the project can succeed or fail.”
How to Measure Gantt Chart Effectiveness
If you use a Gantt chart, measure whether it is helping. These metrics tell you if the schedule is working as a planning tool or just decorating a wall.
| Metric | What It Measures | Why It Matters |
|---|---|---|
| Schedule variance | Planned vs actual task completion dates | Shows whether the schedule reflects reality |
| Milestone hit rate | Percentage of milestones delivered on time | Measures stakeholder commitment reliability |
| Critical path slippage | How much the critical path has shifted | Indicates project finish date risk |
| Blocked task count | Number of tasks waiting on a predecessor | Identifies dependency bottlenecks |
| Baseline variance | Difference between original and current plan | Quantifies scope or schedule drift |
| On-time task completion | Percentage of tasks finished by planned date | Tracks team execution discipline |
| Overdue task count | Tasks past their planned finish date | Signals maintenance gaps |
What Good Gantt Scheduling Looks Like: SaaS Tools in Practice
The difference between a static Gantt bar chart and a live SaaS scheduling system matters. Static tools (Excel, PowerPoint, Canva) draw bars but cannot recalculate dependencies, track progress collaboratively, or flag critical path changes. Live SaaS platforms handle the scheduling logic.
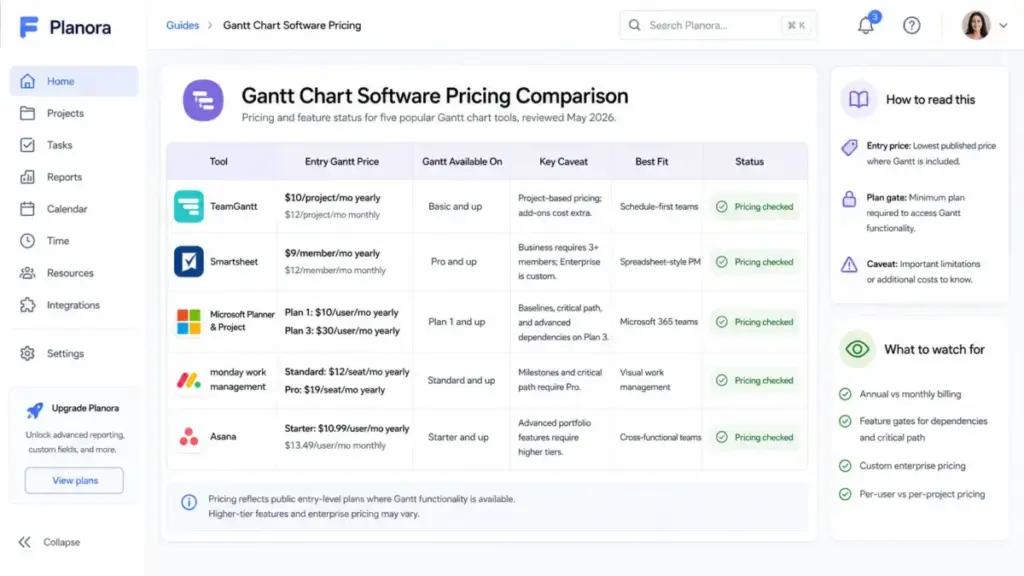
Here is how five SaaS tools implement Gantt scheduling, with pricing status as of May 2026.
TeamGantt
Schedule-first Gantt platform with drag-and-drop scheduling, dependencies, milestones, baselines, critical path, workload tracking, and multiple views. Pricing: Basic at $10/project/month (yearly), with a 14-day free trial. Project-based pricing means cost scales with active projects.
Smartsheet
Spreadsheet-style work management with Gantt view, dependencies, baselines, and critical path tracking. The Smartsheet Gantt chart guide confirms that dependencies and baselines automatically update task dates. Pricing: Pro at $9/member/month (yearly). Business requires 3+ members. If Smartsheet is on your list for Gantt charts, compare Smartsheet replacement options before picking a scheduling tool.
Microsoft Planner and Project
Project supports all four dependency types with lead and lag, baselines, critical path, and desktop/online scheduling. Pricing: Planner Plan 1 at $10/user/month (yearly). Plan 3 at $30/user/month adds advanced dependencies, baselines, and critical path.
monday work management
Gantt Chart View displays items as bars with dependency arrows against a horizontal calendar. The monday.com help center documents the view. Pricing: Standard at $12/seat/month (yearly) and up. Milestones and critical path require Pro tier.
Asana
Timeline and Gantt views on paid plans showing tasks, dependencies, and milestones. Pricing: Starter at $10.99/user/month (yearly). Advanced Gantt capabilities and portfolio features require higher tiers.
Pricing comparison at a glance
| Tool | Entry Gantt Price | Gantt Available On | Key Caveat |
|---|---|---|---|
| TeamGantt | $10/project/month (yearly) | Basic and up | Project-based pricing; add-ons cost extra |
| Smartsheet | $9/member/month (yearly) | Pro and up | Business requires 3+ members; Enterprise is custom |
| Microsoft Planner and Project | $10/user/month (yearly) | Plan 1 and up | Baselines, critical path, advanced dependencies on Plan 3 ($30/user/month) |
| monday work management | $12/seat/month (yearly) | Standard and up | Milestones, critical path gated by Pro plan |
| Asana | $10.99/user/month (yearly) | Starter and up | Advanced Gantt capabilities in higher tiers; goals/portfolios require upgrade |
Tools That Support Gantt Scheduling
Beyond the five tools above, Gantt chart functionality exists across many project management platforms:
Live SaaS tools with dependency logic: Wrike, ClickUp, GanttPRO, and Primavera P6 (for enterprise construction and engineering).
Static or presentation tools: Excel, Google Sheets, PowerPoint, and Office Timeline can draw Gantt bar charts but lack native dependency recalculation, collaboration, or critical path behavior. Use these for reporting or presentations, not for managing a live schedule.
When you need a Gantt tool: Your project has a fixed deadline, 10+ tasks with dependencies, multiple owners, and stakeholder reporting needs. If you only need to track personal tasks without date pressure, a simple task manager is enough.
Gantt Chart Checklist for Beginners
- [ ] Define the project outcome, deadline, and decision owner
- [ ] Break work into phases and tasks (avoid micro-tasks)
- [ ] Estimate duration for each task and record your assumptions
- [ ] Assign one owner per task
- [ ] Map finish-to-start dependencies at minimum
- [ ] Add milestones for approvals, deadlines, and handoffs
- [ ] Check resource capacity before publishing the schedule
- [ ] Save a baseline if the tool supports it
- [ ] Set a weekly update cadence and stick to it
- [ ] Review the critical path after every major change
- [ ] Use filtered views for different audiences
FAQ
What is a Gantt chart in simple terms?
A Gantt chart is a project schedule visual. Tasks sit in rows on the left. A calendar runs across the top. Horizontal bars show when each task starts and ends. Lines between bars show which tasks depend on each other. The chart answers: what needs to happen, when, and in what order.
What is the difference between a Gantt chart and a timeline?
A timeline shows work plotted over time. A Gantt chart adds dependency logic, task ownership, milestones, progress tracking, and sometimes critical path and baseline views. A timeline answers “when does work happen?” A Gantt chart also answers “what depends on what, and what is at risk if a task slips?”
What are the main parts of a Gantt chart?
The core components are: a task list (rows), a time scale (columns), task bars (showing start date, end date, and duration), dependency arrows, milestones, owner assignments, and a progress indicator. Advanced Gantt charts add baselines, critical path highlighting, and resource allocation.
Can Agile teams use Gantt charts?
Yes, but with limits. A high-level release Gantt can track cross-team dependencies, external milestones, and delivery commitments. It should not replace sprint boards, backlogs, or burndown charts for daily execution. PMI’s Disciplined Agile framework recommends keeping Agile Gantt charts high-level and tracking only critical dependencies and milestones.
What is the critical path in a Gantt chart?
The critical path is the longest chain of dependent tasks that determines the project finish date. If any task on this chain is late, the project finish date moves. Identifying the critical path helps project managers focus attention on the tasks that carry the most schedule risk. Most SaaS Gantt tools that support critical path require a paid or higher-tier plan.
Can I make a Gantt chart in Excel?
You can draw a basic Gantt bar chart in Excel using stacked bar charts or conditional formatting. Excel lacks native dependency recalculation, milestone markers, baseline comparison, and collaborative editing. For projects with real sequencing and multiple owners, a SaaS tool saves significant manual work.
Which Gantt chart software is best for small teams?
TeamGantt is built specifically for schedule-first teams and starts at $10/project/month. Smartsheet offers a spreadsheet-familiar interface at $9/member/month with Gantt, dependencies, and baselines included. For teams already using a broader platform, Asana and monday.com include Gantt views alongside other work management features.
When should I not use a Gantt chart?
Skip or simplify the Gantt chart when work is exploratory, rapidly changing, backlog-driven, not date-bound, or better managed with a Kanban board, checklist, or roadmap. A Gantt chart for ad hoc daily tasks creates overhead without scheduling value.
How detailed should a Gantt chart be?
Detailed enough to track dependencies and ownership, but not so detailed that the chart becomes impossible to maintain. A rule of thumb: if you cannot keep every row updated weekly, you have too many rows. Tailor the detail level to the audience. Executives need milestones. Project managers need task-level dependencies.
Why do Gantt charts become hard to maintain?
Because projects change. Scope shifts, owners rotate, dates move, and new dependencies appear. If the team does not update the chart on a regular cadence, the schedule becomes fiction. The fix is process discipline: weekly updates, critical path reviews, and a clear owner for the chart itself.