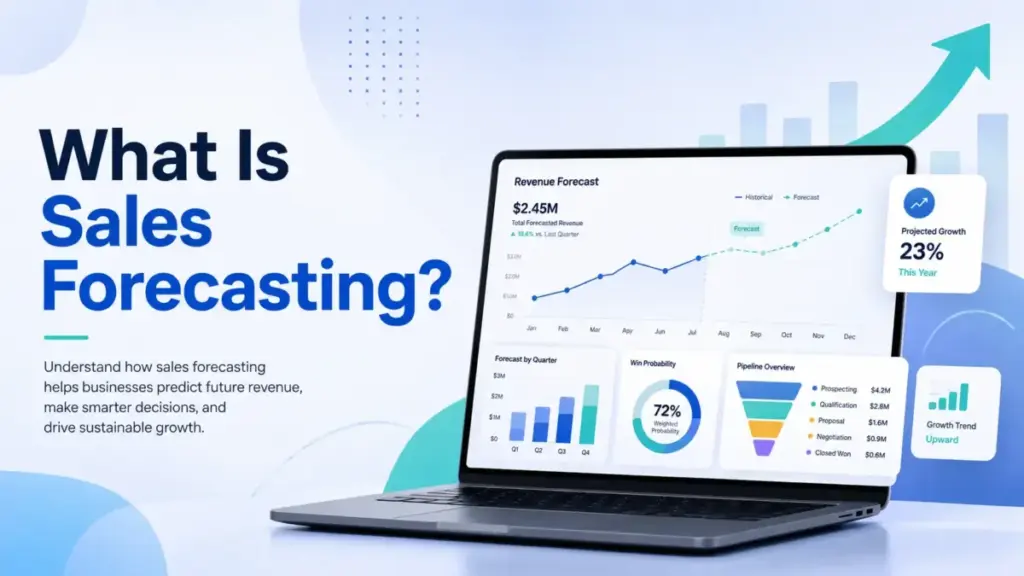
Every sales team needs a reliable revenue estimate, yet most forecasts miss by 20 percent or more. What is sales forecasting? Sales forecasting is the process of estimating future sales revenue over a defined period, using pipeline data, historical performance, win rates, and sales team judgment. It answers a single question: how much revenue will we close this week, this month, or this quarter?
A sales forecast is not a wish list. It is an evidence-based prediction that helps founders plan hiring, helps finance plan cash, and helps managers coach reps on the right deals. When built on clean CRM software data, a forecast becomes the foundation of every revenue decision. When built on guesses, it becomes a weekly fiction.
This guide covers how sales forecasting works, where it breaks, and how to build a forecast you can actually trust. If you are evaluating tools for pipeline and revenue tracking, start with our guide to the best CRM software on the market today.
What Is Sales Forecasting?
Sales forecasting estimates the revenue a team expects to close within a specific time window. It pulls from open opportunities, deal stages, historical close rates, and rep-level judgment to produce a number that finance, leadership, and sales management can use for planning.
As IBM Think puts it: “Sales forecasting is the process of predicting what a company is likely to sell over a future period.”
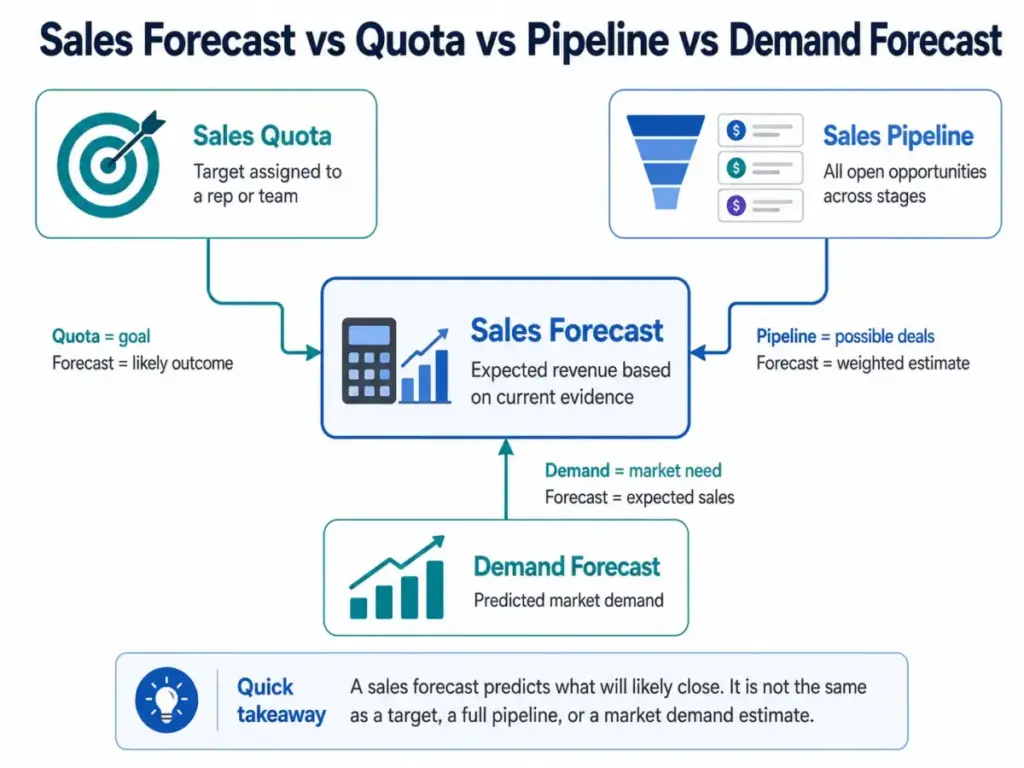
A forecast is not a quota. A quota defines the desired outcome. A forecast predicts the likely outcome. Confusing the two leads to plans built on targets instead of evidence.
A forecast is also not a pipeline total. Your pipeline is the full set of open deals. Your forecast is the revenue estimate you extract from that pipeline after applying probability, timing, and judgment filters.
The 60-Second Version
A sales forecast is the number you expect to close, not the number you hope to close. A good forecast tells finance what cash may arrive, tells managers where pipeline is weak, and tells reps which deals deserve attention this week.
Sales Forecasting vs Quota, Pipeline, and Target
Most forecast confusion starts with blurred definitions. Sales teams mix up forecast, quota, pipeline, target, and demand forecast in weekly calls, and that confusion creates misaligned plans. This table separates the five.
| Term | What It Means | Who Uses It | Example |
|---|---|---|---|
| Sales forecast | Expected revenue based on pipeline evidence | Sales manager, finance, founder | “We expect to close $152,000 this quarter” |
| Sales quota | Revenue target assigned to a rep or team | Sales leadership | “Your Q2 quota is $200,000” |
| Sales pipeline | All open opportunities at any stage | Sales reps, managers | “$300,000 in open deals across 5 reps” |
| Sales target | Company-level revenue goal for a period | CEO, board, finance | “Annual target is $2.4M ARR” |
| Demand forecast | Market-level demand prediction | Product, marketing, supply chain | “Market demand for CRM grew 14% YoY” |
A forecast answers “what will happen.” A quota answers “what should happen.” A pipeline answers “what could happen.” Treating any one of these as the other is how teams build plans on the wrong number.
How Does Sales Forecasting Work?
A sales forecast starts with pipeline data and ends with a revenue estimate. The process follows a repeatable cycle, whether you run it in a spreadsheet or inside a CRM.
Here is the basic workflow:
- Collect pipeline data. Pull every open deal with an amount, close date, stage, and owner.
- Apply probability. Assign a win probability to each deal based on stage, history, or rep judgment.
- Calculate weighted value. Multiply deal amount by probability. A $50,000 deal at 40 percent probability equals $20,000 weighted.
- Categorize deals. Group deals into forecast categories: commit, best case, pipeline, or omitted.
- Roll up by period. Sum weighted values and category totals for the forecast window (week, month, or quarter).
- Compare to quota. Measure the forecast against the target. Identify the gap.
- Review and adjust. Sales managers inspect deals, challenge assumptions, and update categories weekly.
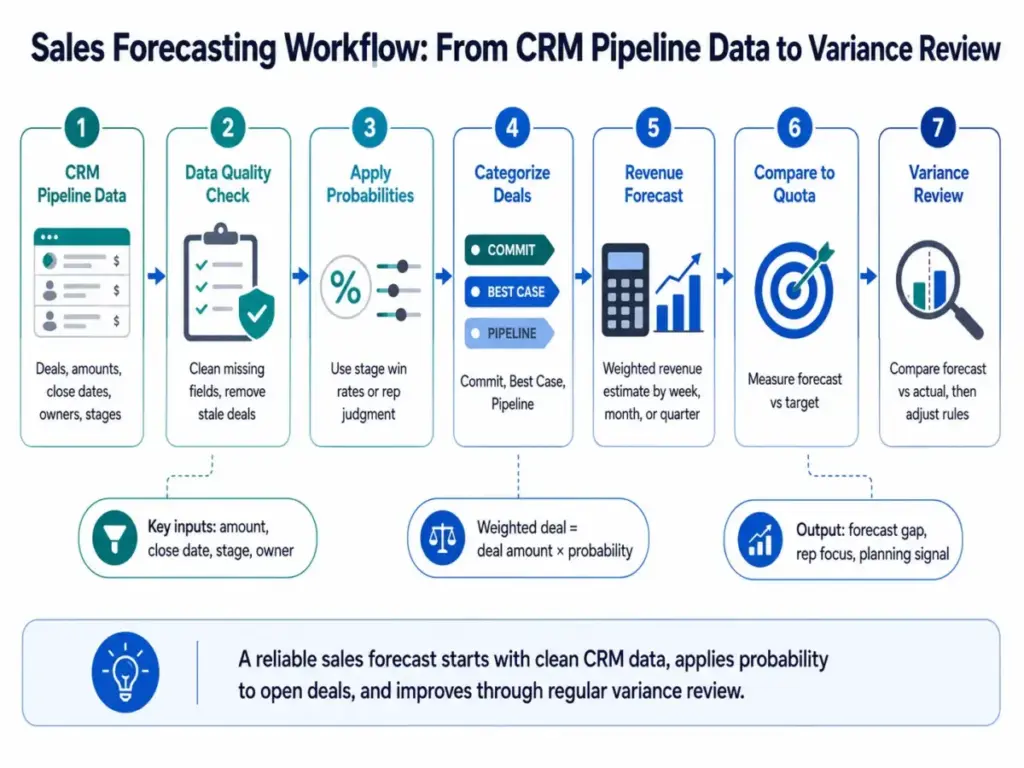
The quality of each step depends on the quality of the data behind it. As Salesforce notes: “They’re only as accurate as the data that fuels them.”
Sales Forecasting Methods
No single forecasting method works for every team. The right method depends on data maturity, team size, sales cycle, and product complexity. Here are six methods most B2B teams will encounter.
| Method | Best For | Data Required | When It Fails |
|---|---|---|---|
| Historical forecasting | Stable businesses with 12+ months of data | Past revenue by period | After a new product launch or market shift |
| Opportunity stage forecasting | Teams with defined pipeline stages | Deal stage, stage-level win rates | When stage definitions are inconsistent or outdated |
| Weighted pipeline forecasting | Mid-maturity teams with CRM data | Deal amount, probability per stage | When reps inflate deal amounts or skip stage updates |
| Length-of-sales-cycle forecasting | Long-cycle B2B or enterprise sales | Average cycle length, deal age | When cycle length varies widely by segment |
| Rep judgment forecasting | Early-stage or founder-led sales | Rep experience, deal knowledge | When reps overcommit or sandbag |
| AI-assisted forecasting | Data-rich teams with clean CRM history | 12+ months of CRM data, consistent usage | When CRM data is incomplete or inconsistent |
Which Method Fits Your Team?
Founder-led sales (1 to 3 reps): Start with rep judgment combined with simple pipeline tracking. You know every deal personally. Add weighted pipeline once you have 6 months of close data.
SMB sales teams (3 to 10 reps): Use weighted pipeline forecasting. Define 5 to 7 stages, assign probabilities based on actual history, and review weekly. This balances accuracy with simplicity.
RevOps-led teams (10+ reps): Combine multivariable forecasting with CRM automation. Use forecast categories (commit, best case, pipeline), automate rollups, and layer AI signals for deal risk detection.
| Team Maturity | Data Quality | Best Forecasting Method | Why It Fits | Main Risk |
|---|---|---|---|---|
| Founder-led sales, 1-3 reps | Low to medium | Rep judgment + simple pipeline tracking | Founder or lead seller knows each deal personally, so qualitative judgment still matters. | Forecast becomes too optimistic because there is little historical data. |
| Early SMB sales team, 3-5 reps | Medium | Opportunity stage forecasting | Basic CRM stages help estimate likely revenue without complex modeling. | Stage probabilities become unreliable if reps update deals inconsistently. |
| Growing B2B team, 5-15 reps | Medium to high | Weighted pipeline forecasting | Deal amount × win probability gives managers a clearer revenue estimate. | Inflated deal values or stale close dates distort the forecast. |
| Mature sales team, 15+ reps | High | Multivariable forecasting | Combines deal stage, win rate, sales cycle, rep performance, and segment data. | Requires clean CRM data and consistent sales process discipline. |
| Enterprise or RevOps-led team | High | AI-assisted forecasting | AI can detect deal risk, forecast variance, and pipeline movement patterns. | AI produces confident but wrong forecasts when CRM data is incomplete. |
| New market or new product launch | Low | Scenario forecasting | Helps model best case, expected case, and downside case when history is limited. | Assumptions can replace evidence if scenarios are not reviewed often. |
| Long-cycle B2B sales | Medium to high | Length-of-sales-cycle forecasting | Deal age and average cycle length help estimate close timing. | Breaks down when sales cycles vary widely by segment or deal size. |
| Spreadsheet-based sales team | Low | Historical forecasting | Past revenue gives a simple starting point before moving into CRM forecasting. | Fails after major changes in pricing, product, market, or sales motion. |
Sales Forecasting Example
A real example shows the math and the gap. Consider a 5-rep B2B SaaS team forecasting Q2 revenue.
The team has $300,000 in open pipeline. Here is the breakdown by forecast category:
- Commit: $80,000 at 90% probability = $72,000 weighted
- Best case: $120,000 at 50% probability = $60,000 weighted
- Early pipeline: $100,000 at 20% probability = $20,000 weighted
Weighted forecast total: $152,000
The quarterly quota is $200,000. That leaves a $48,000 forecast gap.
This gap tells the sales manager three things:
- The team needs to convert more best-case deals to commit, or find new pipeline fast.
- Reps should focus on the $120,000 in best case. What evidence exists that those deals will close?
- Finance should plan for $152,000, not $200,000, unless pipeline changes in the next 4 weeks.
This is forecasting in practice. The number alone is not the value. The value is the gap analysis and the actions it triggers.
Why Sales Forecasts Go Wrong
Most forecast failures are data discipline problems, not math problems. A better model cannot fix fake close dates, vague next steps, or inflated deal probabilities.
Dirty CRM Data
Deals with missing close dates, blank amounts, or wrong stages make any forecast unreliable. If 30 percent of your pipeline has stale or missing data, your forecast inherits that noise.
Inflated Pipeline
Reps add early conversations as deals with optimistic amounts. A “maybe” email thread becomes a $50,000 opportunity. The pipeline looks full, but the forecast is hollow.
Rep Sandbagging
Some reps undercommit deals to protect themselves from missing targets. They label solid deals as “best case” instead of “commit.” The forecast runs low, and the team cannot plan accurately.
Overcommitting and Happy Ears
Other reps do the opposite. They hear positive signals and commit deals that have no buyer-confirmed next step. End-of-quarter pressure makes this worse.
Stale Close Dates
Deals sit with a close date that passed 3 weeks ago. No one updates it. The forecast includes revenue in a period where the buyer has gone silent.
Stage Probability Misuse
Stage probabilities should reflect actual historical win rates, not arbitrary percentages. If your “Proposal Sent” stage closes at 35 percent but your CRM says 60 percent, every forecast inflates the pipeline.
The Forecast Politics Problem
The same people who own revenue outcomes also control the forecast inputs. When a rep’s commission, a manager’s bonus, and a founder’s board presentation all depend on the same number, the number bends toward what people want, not what the data says.
How to Build Your First Sales Forecast
Start with clean data, not a new tool. Teams that jump to AI forecasting before fixing stage definitions and close date rules get faster wrong answers.
Here is a 4-week setup plan for teams moving from spreadsheets to CRM-based forecasting. For a broader guide on CRM setup, see the CRM implementation guide.
Week 1: Clean Deal Stages and Close Dates
Define 5 to 7 pipeline stages with clear entry and exit criteria. Remove or archive deals with close dates more than 30 days past. Every open deal must have a close date, amount, and owner.
Week 2: Define Forecast Categories
Set up three forecast categories: commit, best case, and pipeline. Commit means the buyer has confirmed intent and timeline. Best case means the deal is progressing but not confirmed. Pipeline means it is too early to predict.
Week 3: Add Weighted Probabilities
Assign stage-level probabilities based on your actual close history. If you do not have 6 months of data, use conservative estimates: 10% for early stage, 30% for mid-stage, 60% for late stage, 90% for commit.
Week 4: Compare Forecast vs. Actual
At the end of the month, compare your forecast to actual closed revenue. Calculate forecast variance. If the variance is above 20%, inspect which deals missed and why. Adjust stage probabilities or category definitions.
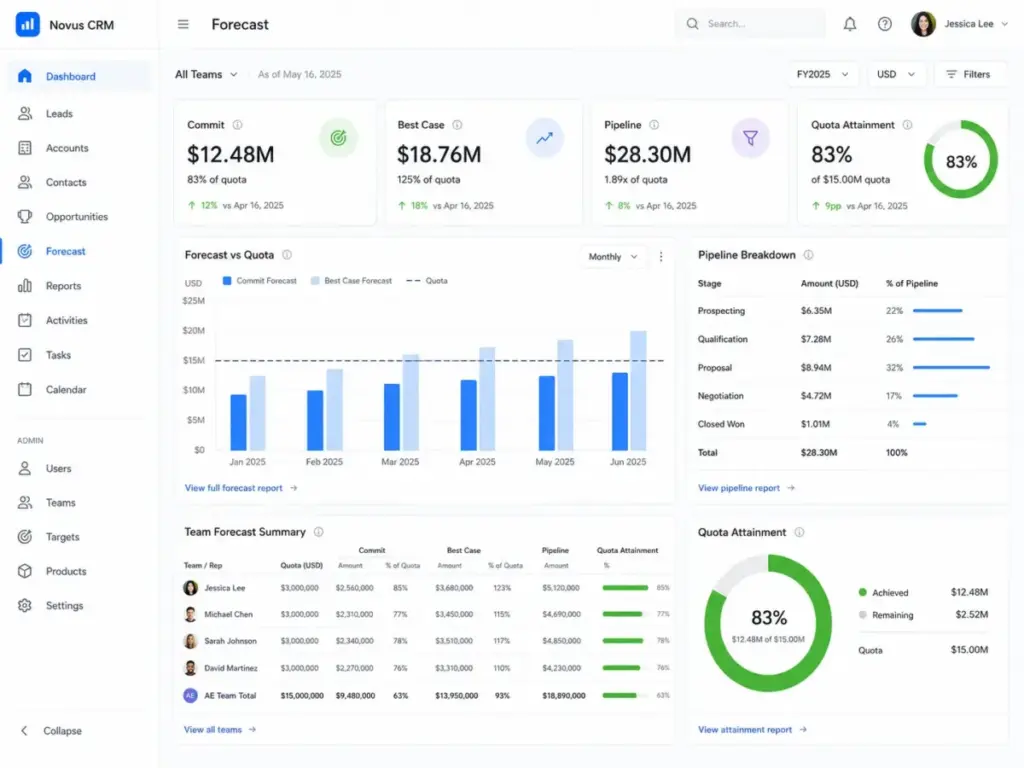
Best Tools for CRM Sales Forecasting
The right CRM turns weekly forecast calls from guessing sessions into data reviews. Here are the features that matter most for sales forecasting, and which tools deliver them.
CRM Forecasting Feature Checklist
Before selecting a tool, confirm it supports these capabilities:
- Forecast categories (commit, best case, pipeline)
- Weighted pipeline amount
- Forecast period (weekly, monthly, quarterly)
- Goal or quota tracking per rep and team
- Forecast submission and approval workflow
- Pipeline reports and dashboards
- Role-based permissions for forecast editing
- AI deal risk signals (optional, useful at scale)
Tool Comparison
| Tool | Best Fit | Key Forecasting Feature | SaaSZap Resource |
|---|---|---|---|
| HubSpot | Teams wanting CRM plus marketing and sales tools in one platform | Built-in forecast tool with category rollups | HubSpot CRM review, HubSpot pricing |
| Salesforce | Larger teams with formal forecast hierarchy and RevOps | Collaborative forecasting with manager adjustments | Salesforce CRM review, Salesforce pricing |
| Pipedrive | Visual pipeline teams and SMB sales-led orgs | Revenue forecast view with weighted pipeline | Pipedrive CRM review |
| Zoho CRM | Budget-conscious teams needing customization | Custom forecast targets with territory and role hierarchy | Zoho CRM review |
| Freshsales | Teams already using Freshworks or wanting AI-assisted CRM | Revenue forecasting with quota tracking | Freshsales review |
No single tool is the best for every team. The right choice depends on team size, budget, existing stack, and how much forecast process your team actually needs. For a direct comparison of two popular options, see our HubSpot vs Salesforce breakdown.
Sales Forecasting Best Practices
The best forecast is the one your team trusts enough to act on. Trust comes from consistent data, clear definitions, and regular review.
Forecast Trust Score: A 10-Point Audit
Use this checklist to score your forecast process from 0 to 10. One point for each item your team follows consistently.
| # | Criteria | What It Checks |
|---|---|---|
| 1 | Every deal has a close date | Timing accuracy |
| 2 | Every deal has a documented next step | Deal progression evidence |
| 3 | Stale deals (no activity 30+ days) are excluded or flagged | Pipeline hygiene |
| 4 | Stage definitions are written and shared | Consistency across reps |
| 5 | Forecast categories are reviewed weekly | Category accuracy |
| 6 | Win rates are based on actual close history | Probability calibration |
| 7 | Commit deals have buyer-confirmed evidence | Commit integrity |
| 8 | Pipeline coverage ratio is calculated | Gap awareness |
| 9 | Forecast vs. actual is reviewed monthly | Feedback loop |
| 10 | Reps cannot change stage definitions casually | Process stability |
Score 8 to 10: Your forecast is auditable and trustworthy. Focus on refining AI signals and scenario modeling.
Score 5 to 7: Your forecast has a foundation but gaps in data quality or process. Fix items 1 through 4 first.
Score below 5: Your forecast is unreliable. Start with the 4-week setup plan above before adding tools or models.
Additional Practices
- Review weekly, not monthly. Forecasts decay fast. A weekly 20-minute review per team catches stale deals early.
- Separate forecast from coaching. The forecast call should inspect data. Coaching should happen in a separate session.
- Track forecast variance. If your forecast consistently misses by 25 percent in one direction, your stage probabilities or rep behavior needs adjustment.
- Use pipeline coverage as an early warning. Most B2B teams need 3x to 4x pipeline coverage to hit quota. If your coverage drops below 2.5x, you have a sourcing problem, not just a closing problem.
As Rob J. Hyndman and George Athanasopoulos write in Forecasting: Principles and Practice: “Forecasting is about predicting the future as accurately as possible.” Accuracy requires that your data reflects genuine patterns, not copied events that will not recur.
FAQ
What is sales forecasting?
Sales forecasting is the process of estimating future revenue over a specific period using pipeline data, historical close rates, and deal-level evidence. It helps businesses plan hiring, spending, and resource allocation by predicting how much revenue the sales team will close, rather than guessing.
Why is sales forecasting important?
Sales forecasting gives finance, leadership, and sales managers a shared revenue expectation. Without it, companies cannot plan cash flow, set realistic budgets, or identify pipeline weaknesses. A reliable forecast prevents both overspending on optimistic projections and under-investing when revenue is actually strong.
How does sales forecasting work?
Sales forecasting works by collecting open deal data from a CRM or spreadsheet, applying win probabilities to each deal based on stage or judgment, and summing weighted values for a specific time period. Managers then review, adjust categories, and compare the forecast to quota weekly or monthly.
What are the main sales forecasting methods?
The six common methods are historical forecasting, opportunity stage forecasting, weighted pipeline forecasting, length-of-sales-cycle forecasting, rep judgment forecasting, and AI-assisted forecasting. Each method fits different data maturity levels. Weighted pipeline is the most widely used for B2B SaaS teams with CRM data.
What is an example of sales forecasting?
A 5-rep team has $300,000 in open pipeline. Commit deals ($80,000 at 90%) produce $72,000 weighted. Best-case deals ($120,000 at 50%) produce $60,000. Early pipeline ($100,000 at 20%) adds $20,000. The weighted forecast totals $152,000 against a $200,000 quota, showing a $48,000 gap.
What data is needed for sales forecasting?
A sales forecast requires deal amount, close date, deal stage, and deal owner at minimum. For better accuracy, add win probability by stage, sales cycle length, lead source, average deal size, historical revenue data, and conversion rates. Recurring revenue businesses also need churn and renewal data.
What is the difference between a sales forecast and a sales pipeline?
A sales pipeline is the set of all open deals at any stage. A sales forecast is the revenue estimate drawn from that pipeline after applying probability, timing, and judgment filters. The pipeline shows what could happen. The forecast predicts what will happen based on current evidence.
What is the difference between a sales forecast and a sales quota?
A sales forecast predicts the revenue a team is likely to close based on pipeline evidence. A sales quota is a target assigned by leadership that defines desired performance. As Hyndman and Athanasopoulos note, forecasting, goals, and planning are different tasks. Confusing them leads to poor planning.
How do you improve sales forecast accuracy?
Start with CRM data hygiene: clean close dates, accurate deal amounts, and consistent stage definitions. Base stage probabilities on actual historical win rates, not estimates. Review forecasts weekly. Track forecast variance monthly and adjust probabilities when the variance exceeds 15 to 20 percent.
What are common sales forecasting mistakes?
The most common mistakes are dirty CRM data, inflated pipeline from unqualified deals, stale close dates that no one updates, rep sandbagging or overcommitting, outdated stage probabilities, and treating forecasts as quotas. Most of these are data discipline problems, not modeling problems.
What tools are used for sales forecasting?
CRM platforms like HubSpot, Salesforce, Pipedrive, Zoho CRM, and Freshsales include built-in forecasting features. These tools automate pipeline rollups, weighted calculations, and forecast category management. Some teams also use spreadsheets, but CRMs reduce manual error and provide real-time pipeline views.
Can AI make sales forecasting more accurate?
AI can improve forecast accuracy by detecting deal risk signals, identifying stale opportunities, and finding patterns in historical win/loss data. But AI forecasting is only useful after stage definitions, close dates, and lead scoring rules are consistent. AI applied to dirty CRM data produces confident but wrong predictions.
Key Takeaways
- Sales forecasting estimates future revenue using pipeline data, win rates, and deal evidence, not targets or wishes.
- A forecast is different from a quota, a pipeline, a target, and a demand forecast. Define each clearly for your team.
- Weighted pipeline forecasting is the most practical method for B2B SaaS teams with 6+ months of CRM data.
- Most forecast failures come from data discipline problems: stale dates, inflated amounts, inconsistent stages.
- Use the Forecast Trust Score checklist to audit your process before adding new tools or AI.
- Start with a 4-week setup: clean stages, define categories, add probabilities, then compare forecast vs. actual.
- The forecast is not the number. The forecast is the evidence trail behind the number.